Fig. 3.
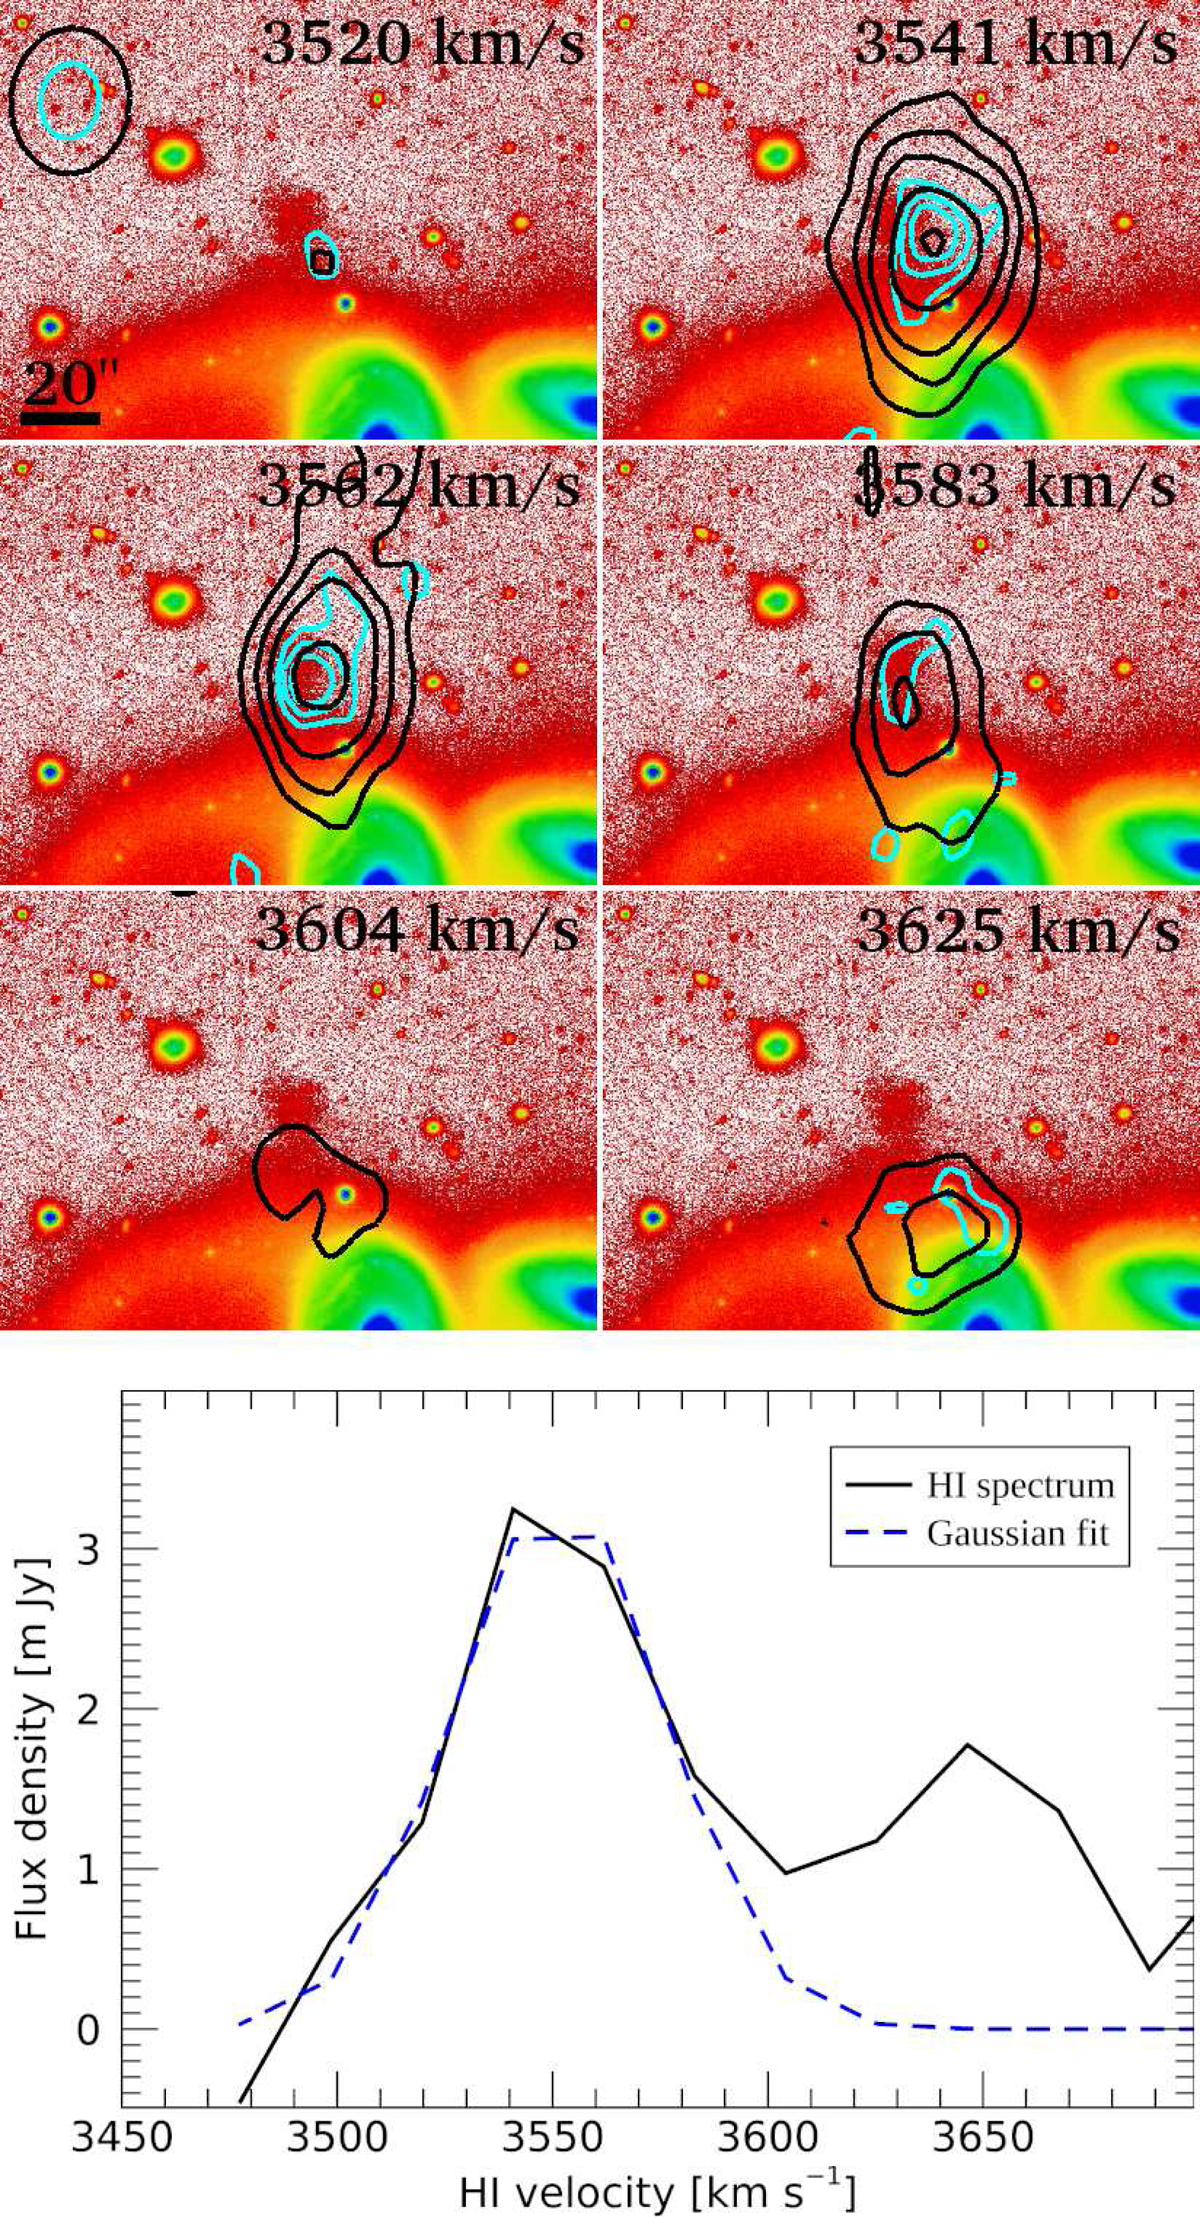
H I distribution of HCG 16-LSB1. Upper panels: velocity channel maps corresponding to high (light blue) and low (black) resolutions of the H I emission plotted over a high contrast g + r optical image. The beam size for both resolutions is placed in the upper left corner (see text). We note that the H I emission in the plotted velocity channels is not associated with the bright galaxies (HCG 16a and HCG 16b) south of HCG 16-LSB1 (see Fig. 1). Bottom panel: H I spectrum obtained from the channels (high resolution data) presented in the upper panel (i.e., integrated over HCG 16-LSB1; see Sect. 2.2 for details). The peak emission is fitted with a Gaussian function.
Current usage metrics show cumulative count of Article Views (full-text article views including HTML views, PDF and ePub downloads, according to the available data) and Abstracts Views on Vision4Press platform.
Data correspond to usage on the plateform after 2015. The current usage metrics is available 48-96 hours after online publication and is updated daily on week days.
Initial download of the metrics may take a while.