Fig. 1.
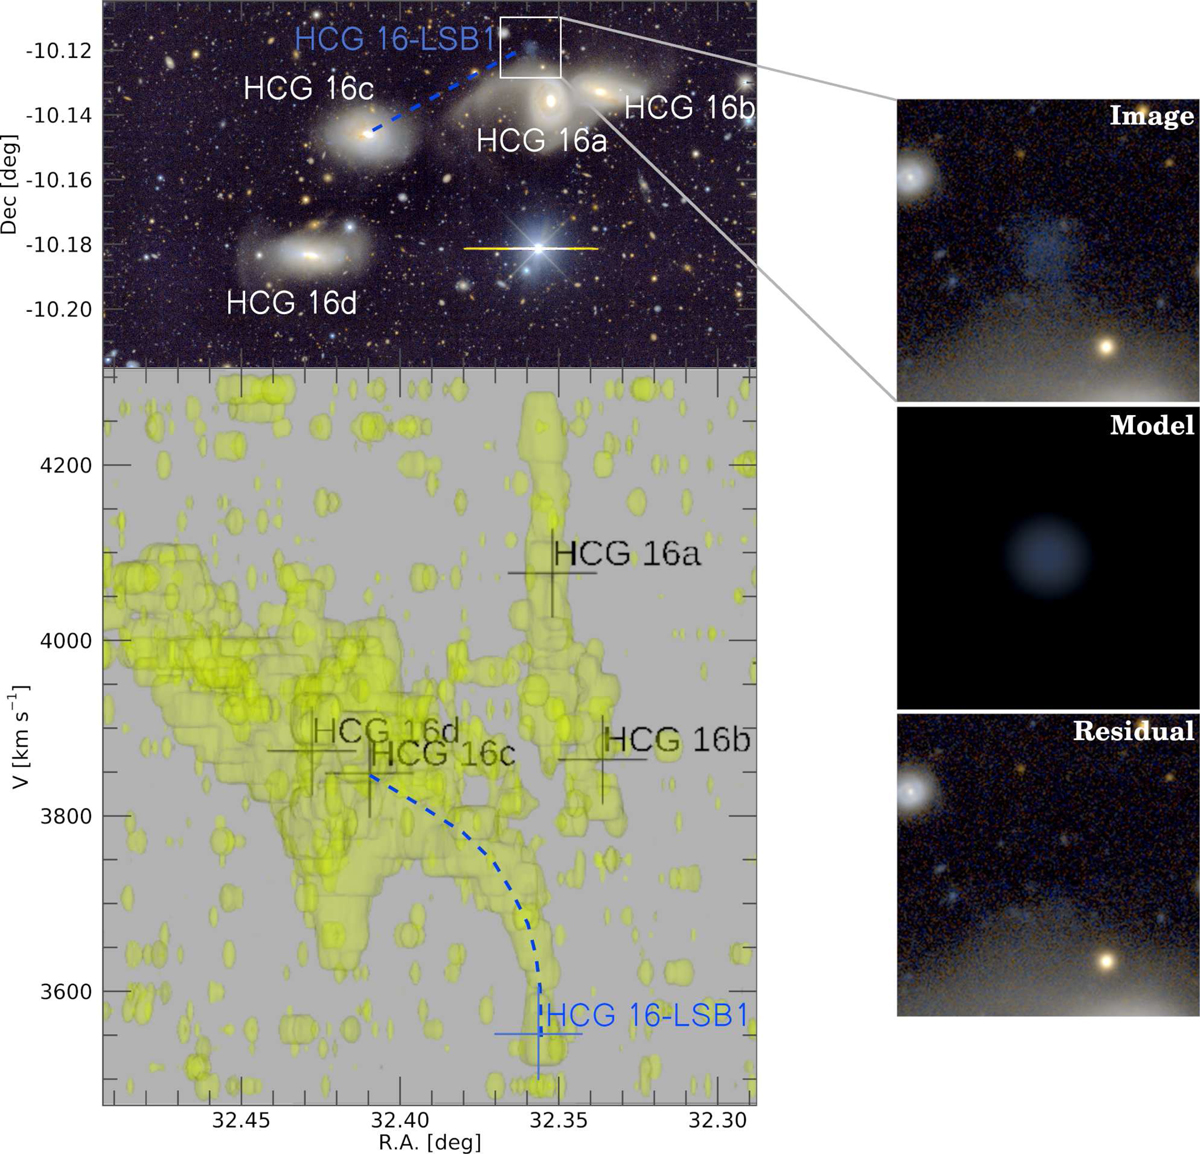
Illustration of the structures present in the northwestern region of HCG16. Upper left panel: color-composed image using the g, r, and z optical bands from DECaLS. Lower left panel: pseudo zenith view (RA vs. H I velocity) of the H I emission higher than 3σrms. Integrated moment-zero and first moment maps as well as detailed information about these data and maps for the whole group can be found in Jones et al. (2019). The dashed blue line in both left panels shows the trajectory of the H I tail, the end of which coincides with the diffuse object detected in the optical. We note that the progenitor of HCG 16-LSB1 is most likely HCG 16c and not the apparently closest galaxy (in projection), HCG 16a. Right panels: zoom-in of the object and its fitting using optical bands through a Sérsic model.
Current usage metrics show cumulative count of Article Views (full-text article views including HTML views, PDF and ePub downloads, according to the available data) and Abstracts Views on Vision4Press platform.
Data correspond to usage on the plateform after 2015. The current usage metrics is available 48-96 hours after online publication and is updated daily on week days.
Initial download of the metrics may take a while.