Fig. B.1.
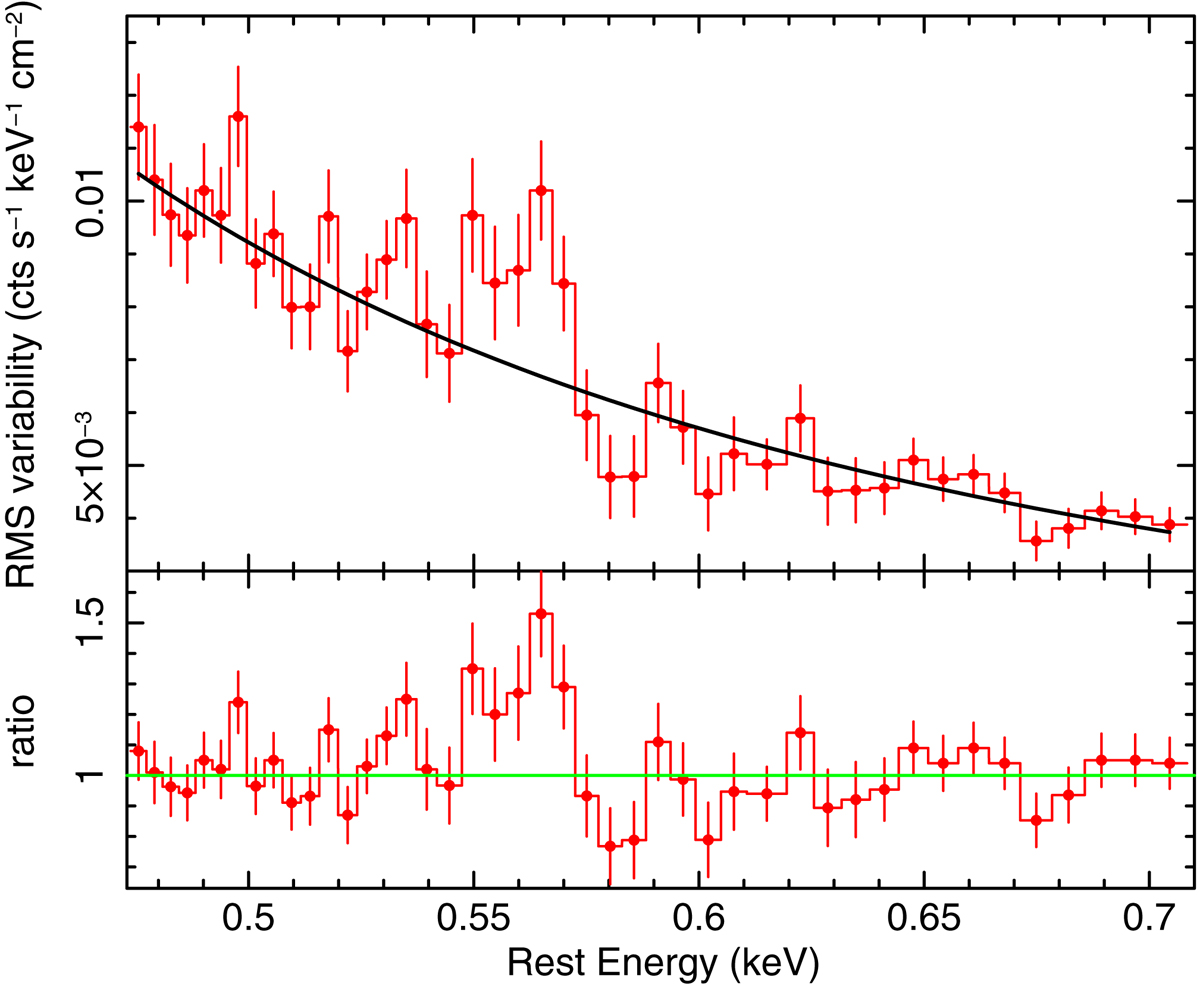
Spectrum showing the rms variability of Mrk 110, computed across the six RGS observations in the O band. Upper panel: rms spectrum in counts space, compared to a power-law component (black line) for the variable continuum. Lower panel: ratio of the rms spectrum to the powerlaw model, where an excess is visible in the O VII emission band between 0.54–0.57 keV. This confirms the line variability across all six spectra, as is presented in the main article.
Current usage metrics show cumulative count of Article Views (full-text article views including HTML views, PDF and ePub downloads, according to the available data) and Abstracts Views on Vision4Press platform.
Data correspond to usage on the plateform after 2015. The current usage metrics is available 48-96 hours after online publication and is updated daily on week days.
Initial download of the metrics may take a while.