Fig. A.3.
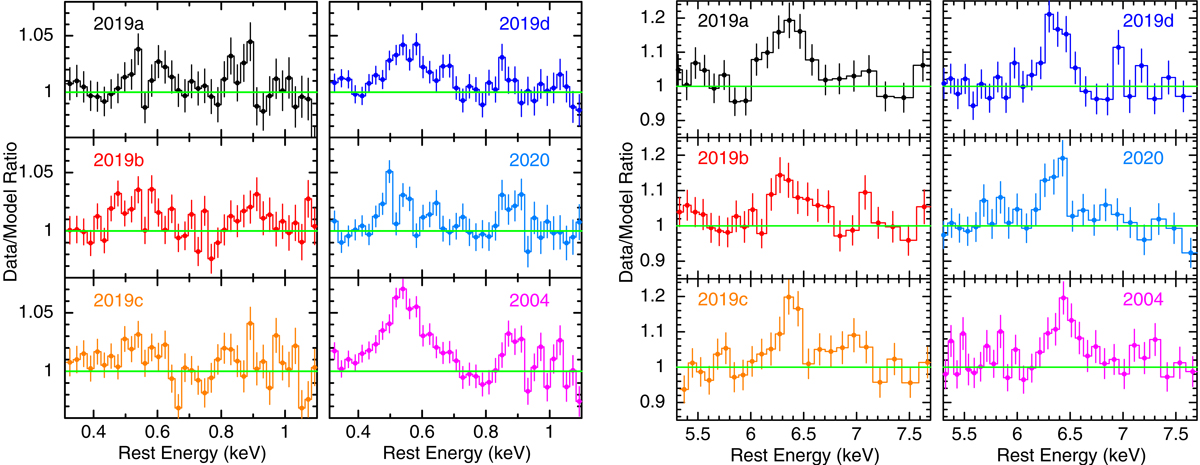
Six left panels: EPIC-pn ratio residuals of all six spectra between 0.3 and 1.1 keV, compared to the two component continuum model as described in the main text. Significant excess residuals are seen over the 0.5–0.6 keV O VII line region, in particular towards the 2004, 2019d, and 2020 pn spectra, where the thin filter was in place. The excess emission can be fitted with a Gaussian profile, with line fluxes as reported in Table A.1. As per the RGS analysis, the pn data show a similar trend between the line flux and the continuum, whereby the strongest line emission is found in the brightest (2004) observation and the weakest line flux is found in the two faintest (2019a, 2020) observations. Six right panels: equivalent data/model ratio plots showing all six pn spectra over the iron K band, where the iron line emission is less variable.
Current usage metrics show cumulative count of Article Views (full-text article views including HTML views, PDF and ePub downloads, according to the available data) and Abstracts Views on Vision4Press platform.
Data correspond to usage on the plateform after 2015. The current usage metrics is available 48-96 hours after online publication and is updated daily on week days.
Initial download of the metrics may take a while.