Fig. A.2.
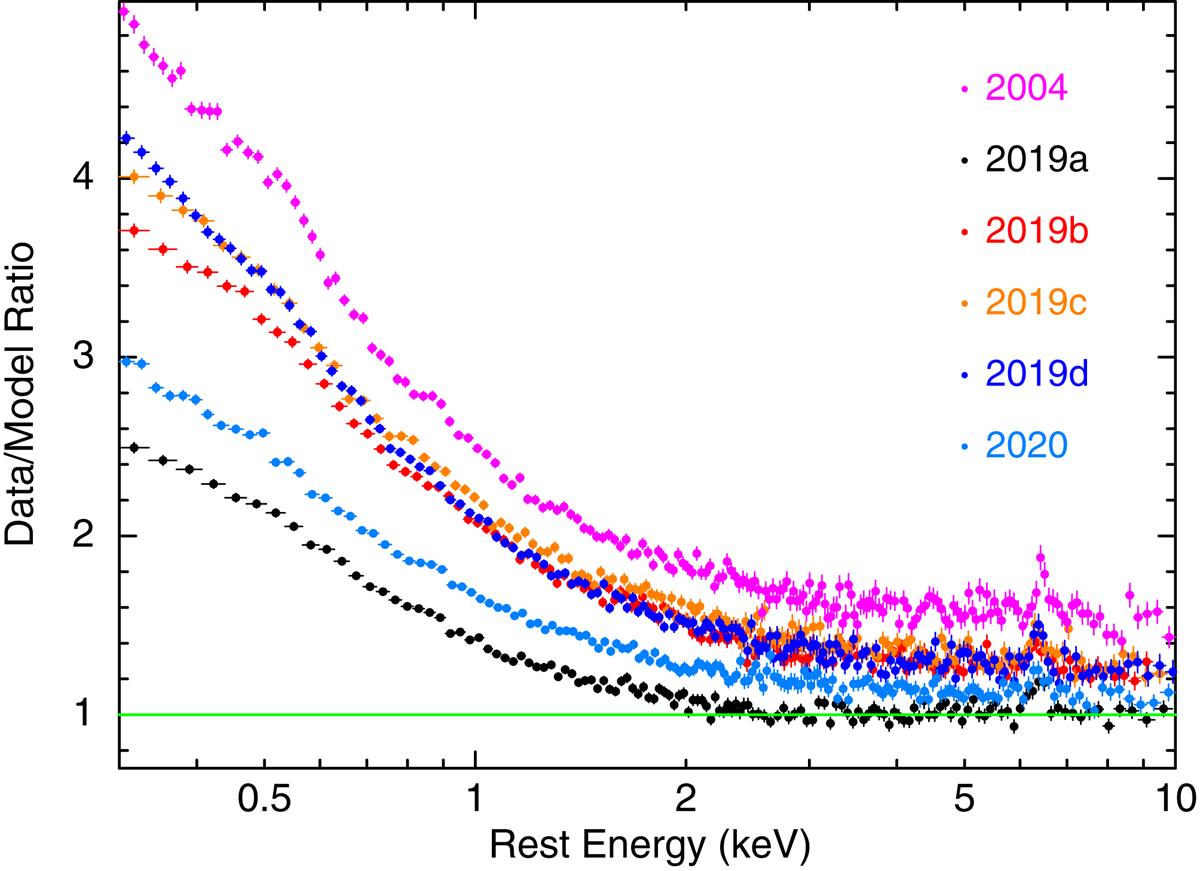
All six EPIC-pn spectra of Mrk 110. The spectra are plotted as a ratio against a power continuum of Γ = 1.63 ± 0.01, fitted to the faintest 2019a observation over the 2.5–10 keV band. All the spectra show a soft X-ray excess against the power-law continuum, with the excess being most prominent in the brightest observations. The continuum in all six spectra can be fitted with a two-component model, consisting of Comptonised soft X-ray emission from the disk and a hard X-ray power-law. A weak iron K line at 6.4 keV is also present in all the observations. The EPIC-pn spectra have been re-binned by a further factor of ×5 above the native binning of 100 counts per bin for display purposes.
Current usage metrics show cumulative count of Article Views (full-text article views including HTML views, PDF and ePub downloads, according to the available data) and Abstracts Views on Vision4Press platform.
Data correspond to usage on the plateform after 2015. The current usage metrics is available 48-96 hours after online publication and is updated daily on week days.
Initial download of the metrics may take a while.