Fig. 4.
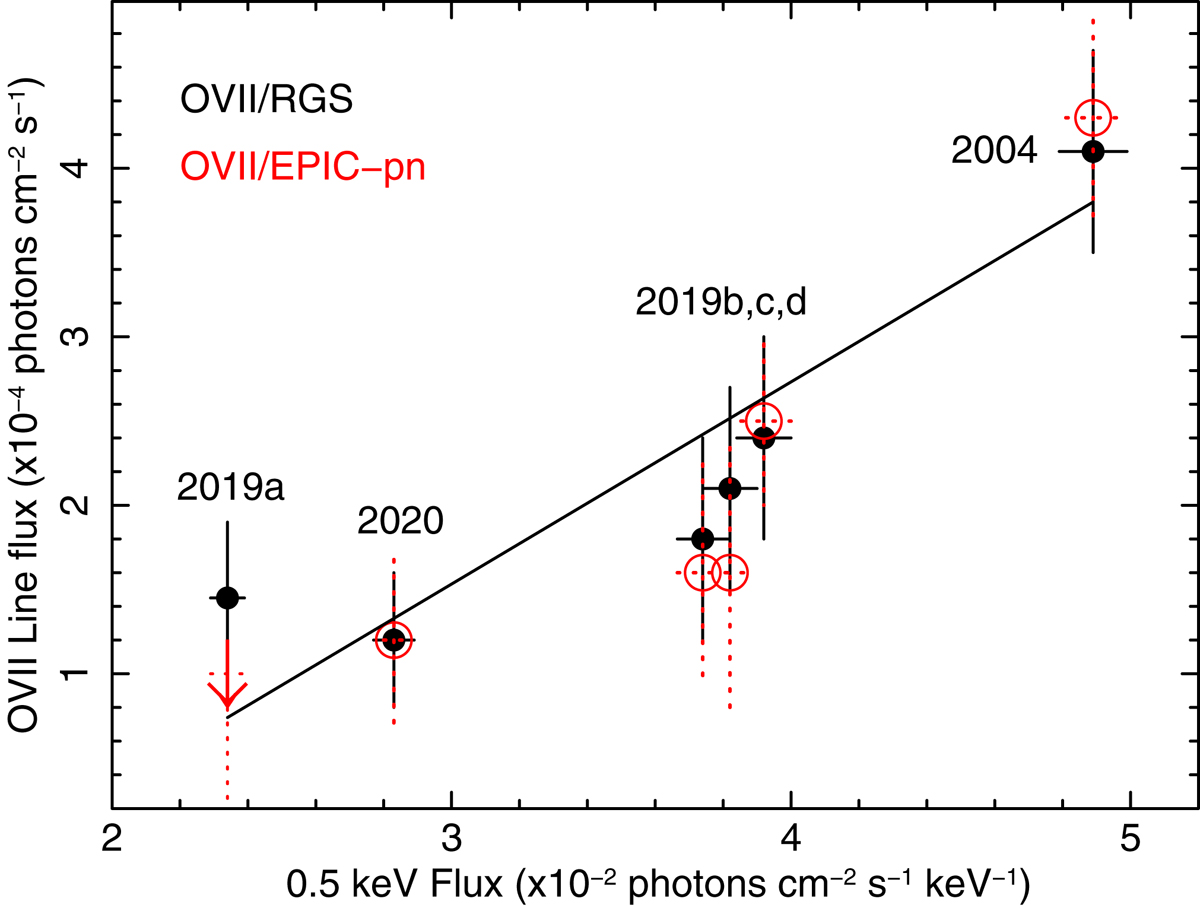
O VII line flux, as inferred by the KYRLINE model, plotted against the monochromatic continuum flux at 0.5 keV. The six RGS observations show a positive trend, with the line flux (black circles) increasing with the continuum flux. The solid line shows the best fit correlation to the RGS data, which is significant at 99.7% confidence. A positive trend is also inferred from the EPIC-pn data, the red open circles (plus an upper limit in 2019a, red arrow) show these corresponding line fluxes.
Current usage metrics show cumulative count of Article Views (full-text article views including HTML views, PDF and ePub downloads, according to the available data) and Abstracts Views on Vision4Press platform.
Data correspond to usage on the plateform after 2015. The current usage metrics is available 48-96 hours after online publication and is updated daily on week days.
Initial download of the metrics may take a while.