Fig. 3.
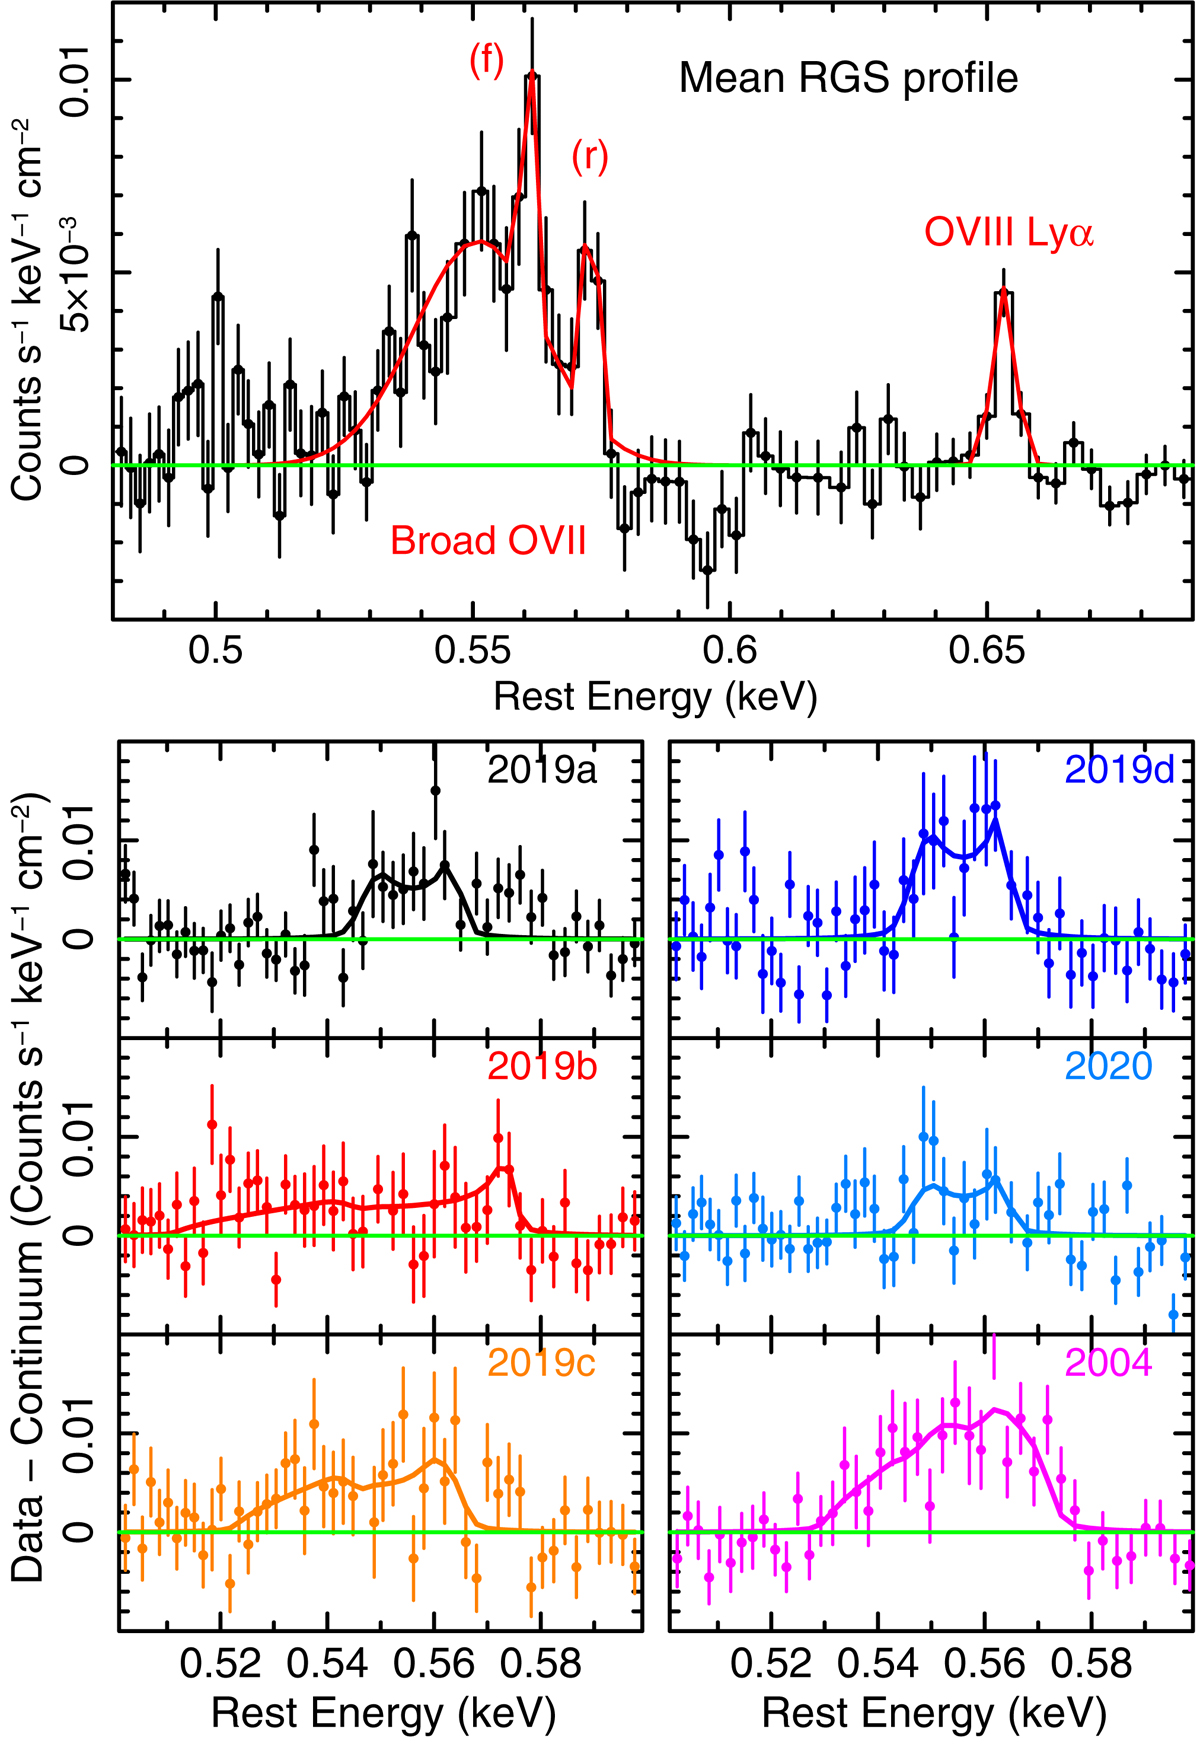
Data minus continuum residuals for the mean spectrum (upper panel) and each of the six RGS observations (lower six panels), over the O VII band. Overlaid (solid line) is the best-fit line profile, fitted with the KYRLINE model for the six observations and with the composite Gaussian model for the mean spectrum. The line flux is variable between the six spectra, being strongest at higher fluxes (2004 observation) and weakest at lower fluxes (2019a and 2020 observations). The profile shape is also variable, which may be attributed to arising from different disk radii, the broadest profiles (2004, 2019b, and c) occurring from emission closer to the black hole. The line parameters are listed in Table 2.
Current usage metrics show cumulative count of Article Views (full-text article views including HTML views, PDF and ePub downloads, according to the available data) and Abstracts Views on Vision4Press platform.
Data correspond to usage on the plateform after 2015. The current usage metrics is available 48-96 hours after online publication and is updated daily on week days.
Initial download of the metrics may take a while.