Fig. 1.
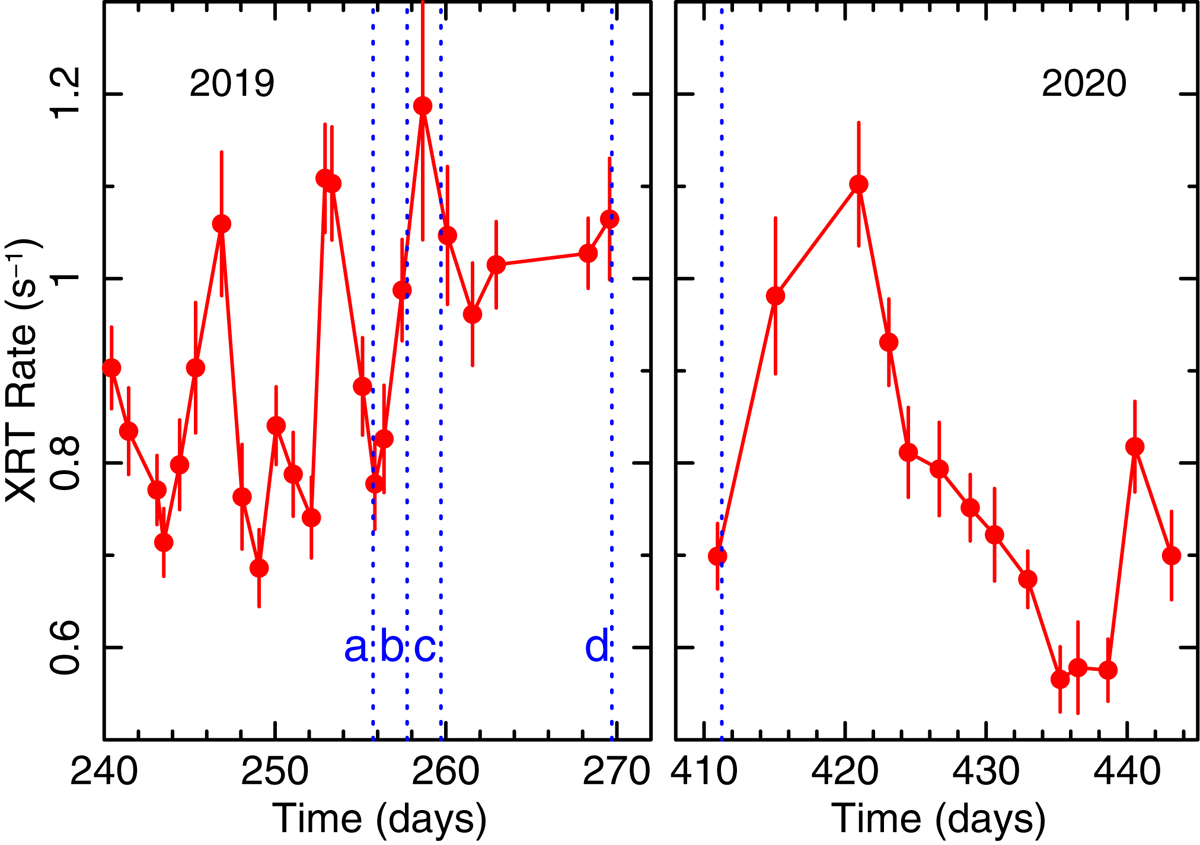
Swift XRT (0.3–2.0 keV) light curve of Mrk 110, showing the portions closest to the times of five of the XMM-Newton observations. The XMM-Newton start times are marked with vertical dotted lines, with four occurring in November 2019 (a − d respectively) and one in April 2020 at the start of the 2020 Swift monitoring period. Mrk 110 shows factor of two soft X-ray variability. Time is plotted from the beginning of the 2019–20 Swift monitoring, which commenced on February 20, 2019.
Current usage metrics show cumulative count of Article Views (full-text article views including HTML views, PDF and ePub downloads, according to the available data) and Abstracts Views on Vision4Press platform.
Data correspond to usage on the plateform after 2015. The current usage metrics is available 48-96 hours after online publication and is updated daily on week days.
Initial download of the metrics may take a while.