Fig. 6.
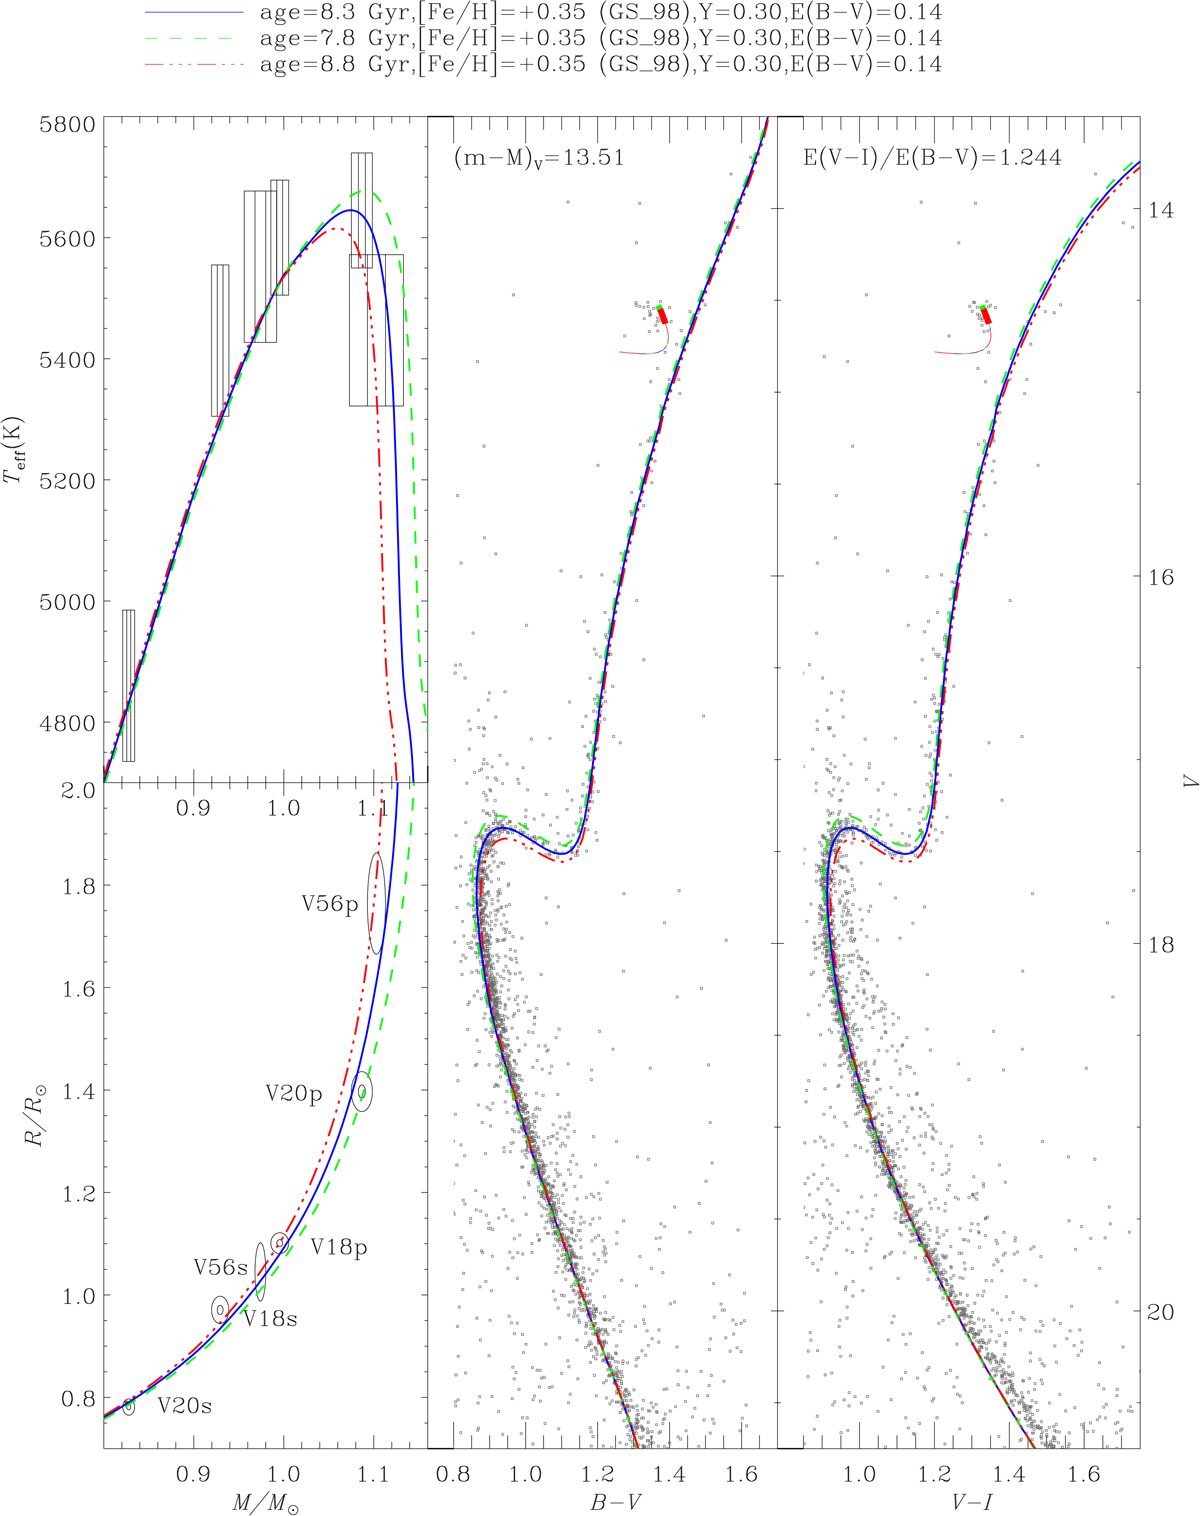
Measurements of V56 and the eclipsing binaries V18 and V20 (left panels) and cluster CMDs (middle and right panels) compared to Victoria model isochrones and ZAHB loci as described in Brogaard et al. (2012). Uncertainties shown in the left panels are 1σ and 3σ for mass and radius of V18 and V20, but only 1σ for V56, and 1σ for all Teff values. GS_98 denotes the solar abundance pattern of Grevesse & Sauval (1998). The thick part of the ZAHB corresponds to masses with an RGB mass-loss from zero to twice the mean mass loss found from asteroseismology by Miglio et al. (2012).
Current usage metrics show cumulative count of Article Views (full-text article views including HTML views, PDF and ePub downloads, according to the available data) and Abstracts Views on Vision4Press platform.
Data correspond to usage on the plateform after 2015. The current usage metrics is available 48-96 hours after online publication and is updated daily on week days.
Initial download of the metrics may take a while.