Free Access
Fig. 5.
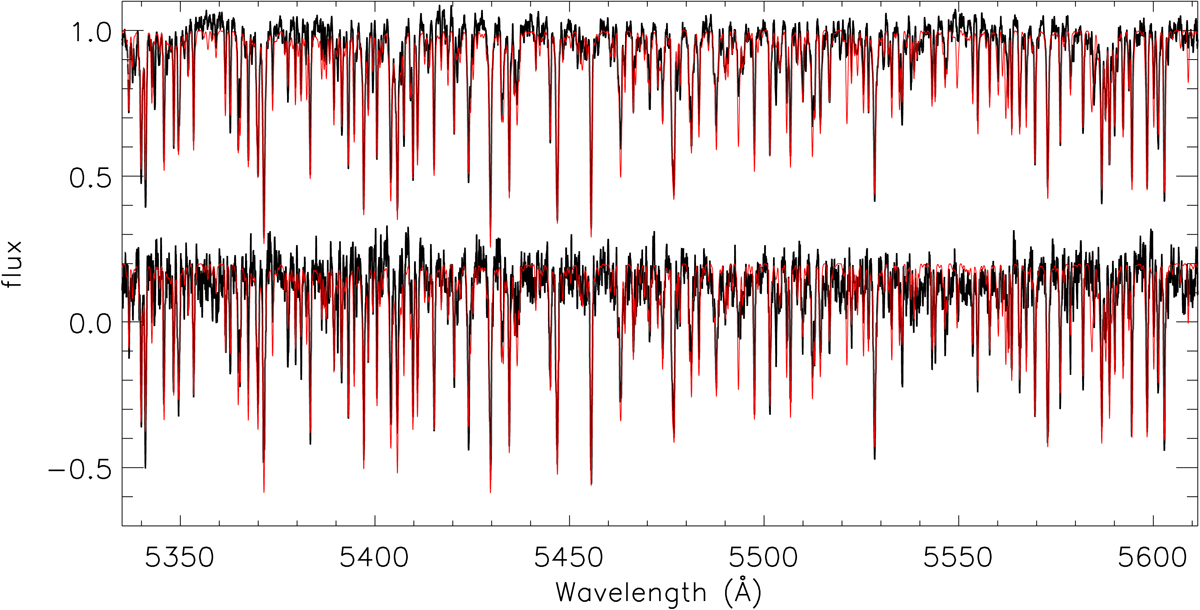
Disentangled and renormalised spectra of the V56 components, primary on top, secondary below. The flux level of the secondary spectrum has been shifted from by −0.8 from 1 for clarity. The observed spectra are shown in black, the model spectra from Sect. 3.8 are overplotted in red.
Current usage metrics show cumulative count of Article Views (full-text article views including HTML views, PDF and ePub downloads, according to the available data) and Abstracts Views on Vision4Press platform.
Data correspond to usage on the plateform after 2015. The current usage metrics is available 48-96 hours after online publication and is updated daily on week days.
Initial download of the metrics may take a while.