Fig. 2.
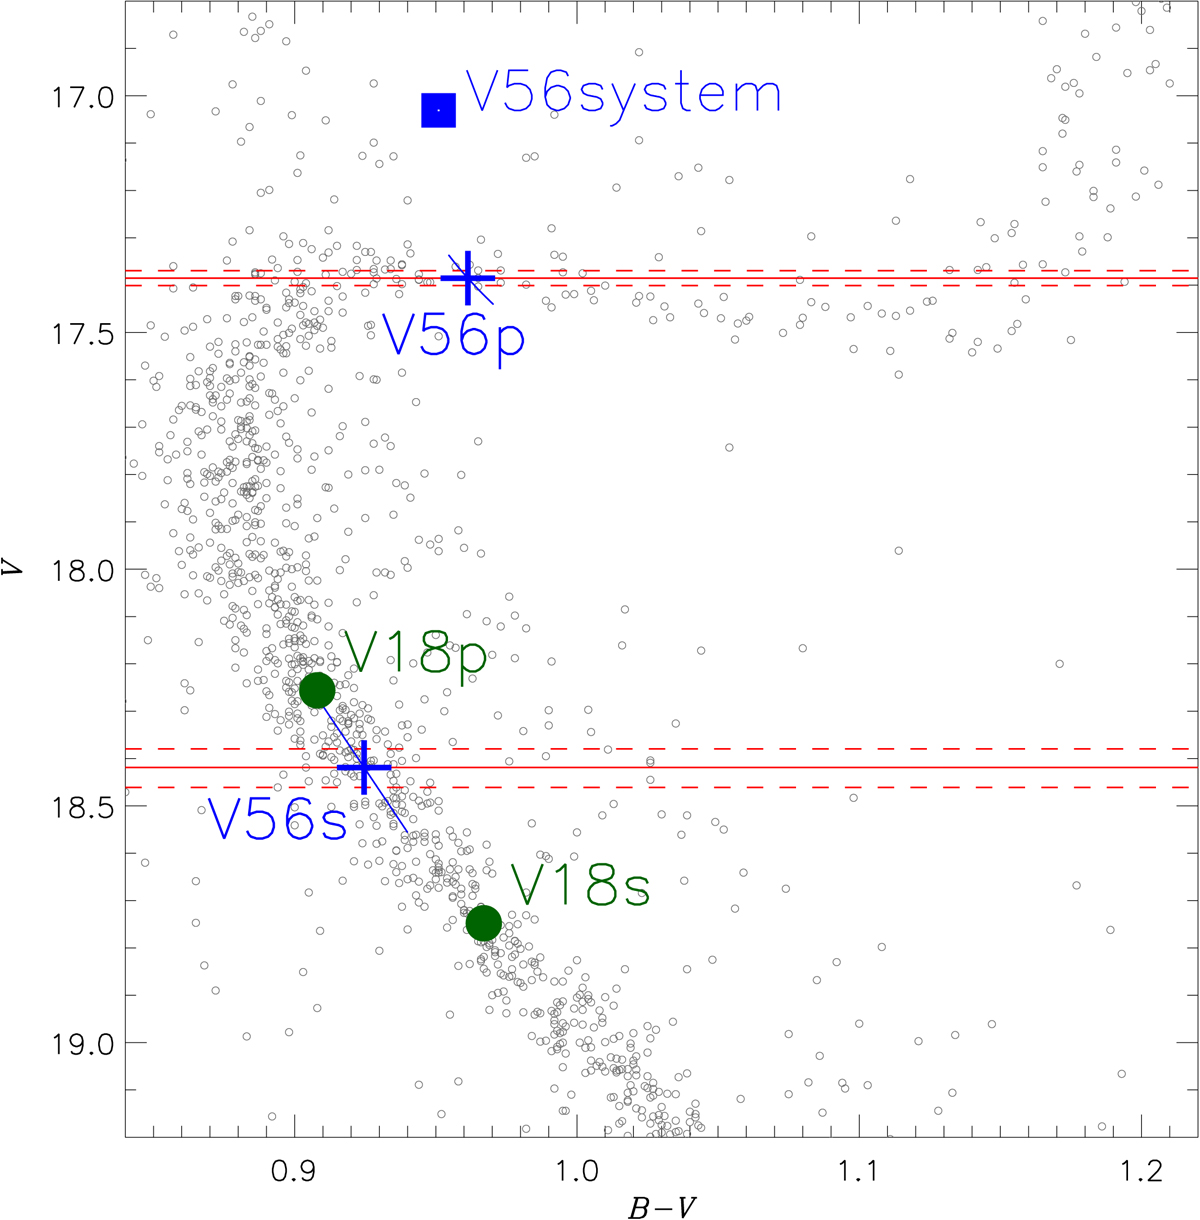
V56 in the CMD of NGC6791. Grey dots are the photometry of NGC 6791 from Brogaard et al. (2012). The blue square represents the total light of V56. The blue line segments correspond to a range of pairs of V56 component magnitudes that combine to the total light magnitude while having one component on the cluster main sequence. The solid red lines give the V56 component V-band magnitudes as calculated from the total light magnitude and the spectroscopic light ratio. Dashed red lines are the corresponding 1σ uncertainties. Blue crosses are the best estimate V56 component magnitudes from the combined constraints of the cluster sequence and the spectroscopic light ratio. Green circles are the V18 component magnitudes.
Current usage metrics show cumulative count of Article Views (full-text article views including HTML views, PDF and ePub downloads, according to the available data) and Abstracts Views on Vision4Press platform.
Data correspond to usage on the plateform after 2015. The current usage metrics is available 48-96 hours after online publication and is updated daily on week days.
Initial download of the metrics may take a while.