Fig. 2.
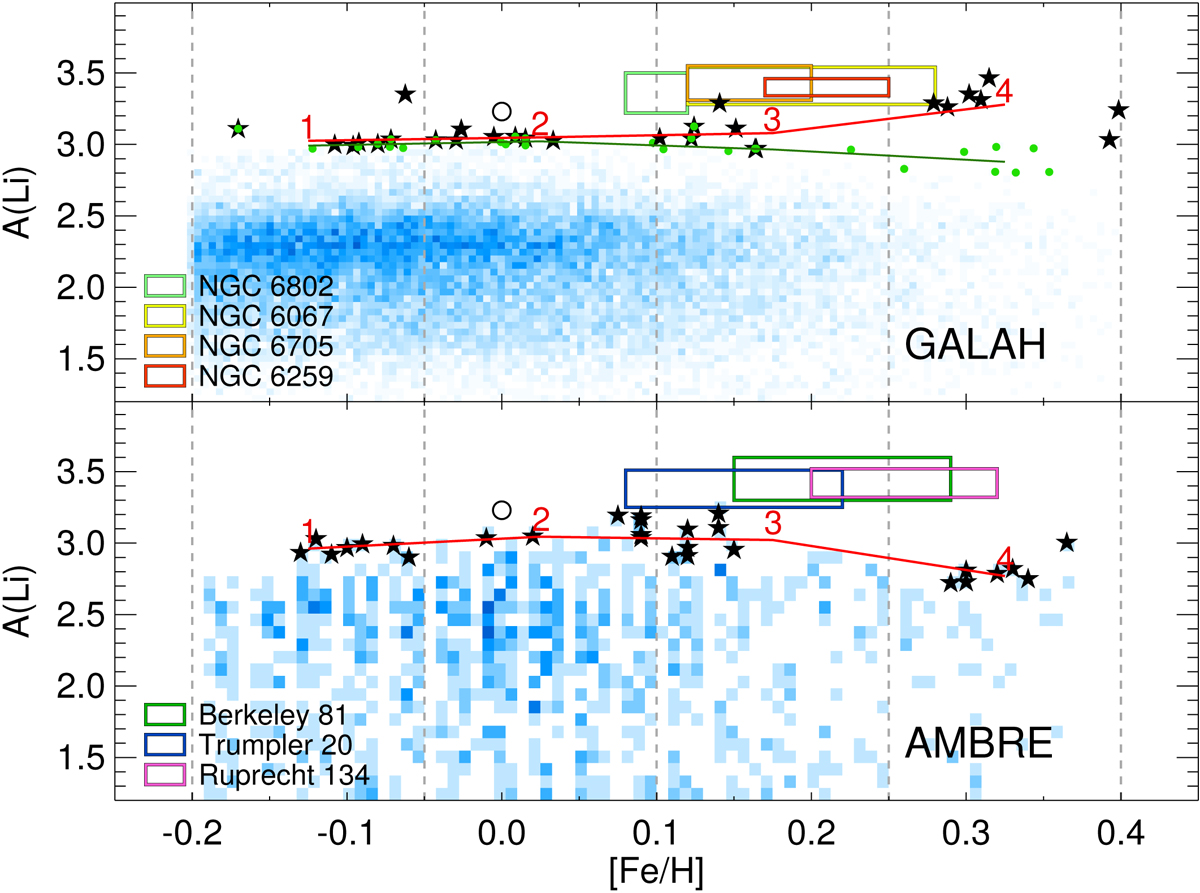
Number density plot showing lithium abundance A(Li) of the GALAH DR3 (upper panel) and AMBRE (bottom panel) stars versus [Fe/H] (colour-coded number densities have different scales on the panels). The upper Li-envelope (red line) connects the mean A(Li) of the seven most Li-rich stars (black stars) in each bin. The dark green line connects the mean A(Li) obtained with GALAH data when using only cool stars from the same Teff range as in the AMBRE sample (green points). Coloured boxes represent super-solar metallicity open clusters with sizes of 1σ confidential intervals on [Fe/H] and A(Li)max from Randich et al. (2020). In all the clusters shown, the Li data were obtained for early-F type stars from the hot side of the Li dip. The open circle indicates the meteoritic value.
Current usage metrics show cumulative count of Article Views (full-text article views including HTML views, PDF and ePub downloads, according to the available data) and Abstracts Views on Vision4Press platform.
Data correspond to usage on the plateform after 2015. The current usage metrics is available 48-96 hours after online publication and is updated daily on week days.
Initial download of the metrics may take a while.