Fig. 4.
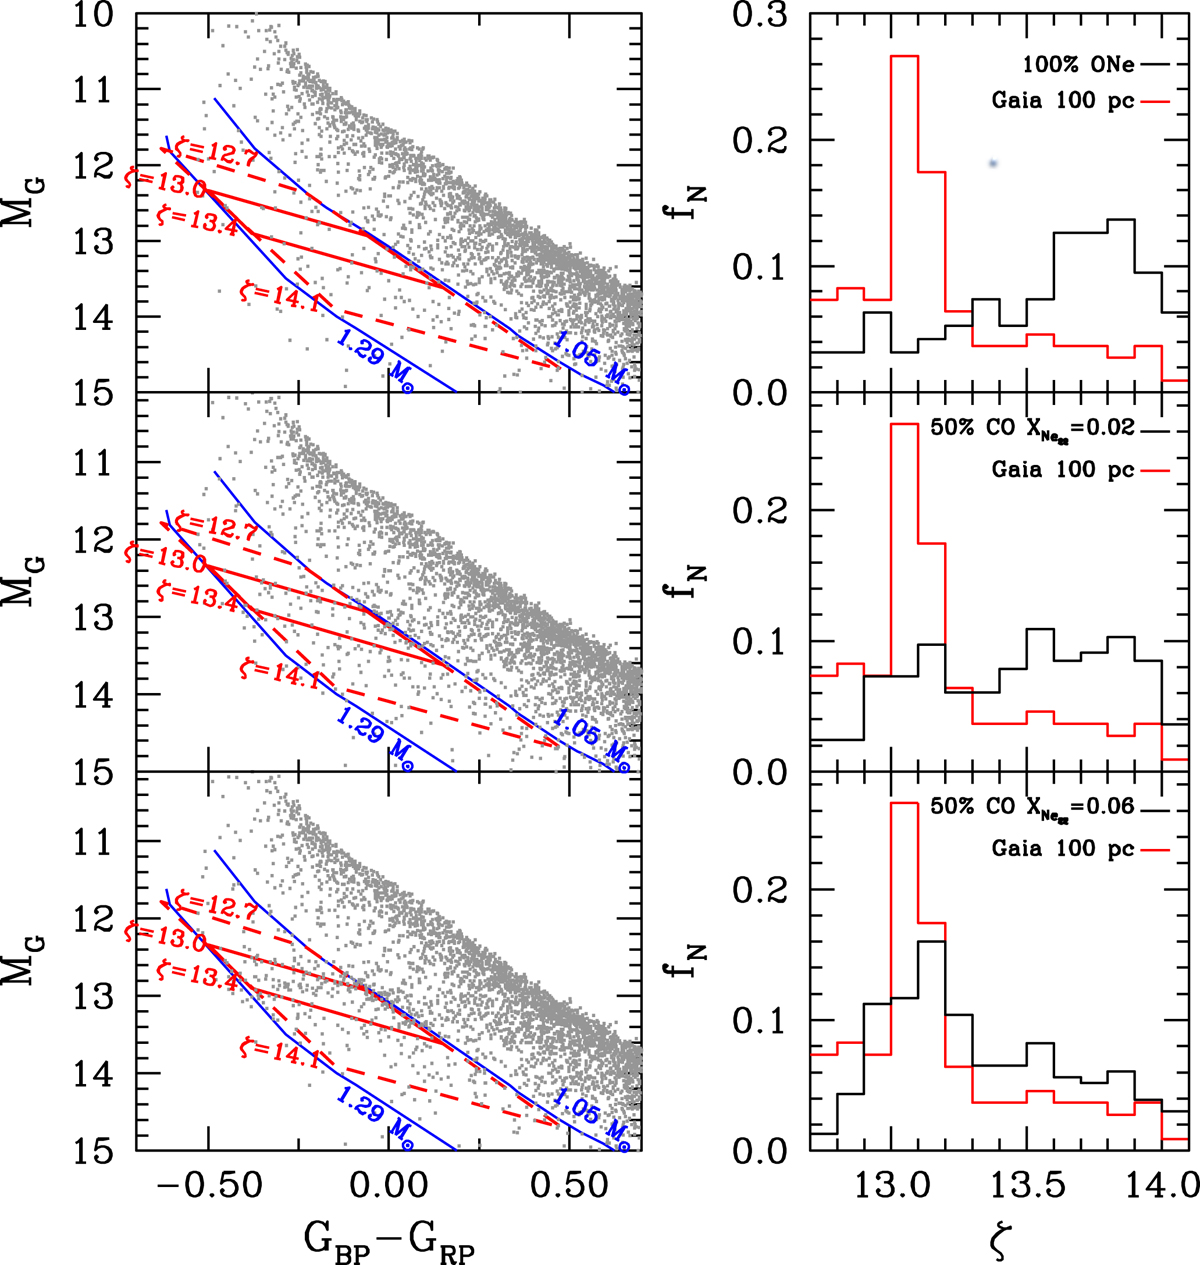
Left panels: synthetic WD populations (grey points) in the Gaia Hertzsprung-Russell diagram considering different prescriptions. The ultramassive Q branch is delimited by solid red lines. Dashed red lines mark the region where we have counted WDs to prepare the histograms. Right panels: synthetic (black line) and observed (red line) histograms for the 100 pc WD population. The observed Q branch can be regarded as the red peak between ζ = 13.0 and ζ = 13.4 in the 100 pc WD sample observed by Gaia.
Current usage metrics show cumulative count of Article Views (full-text article views including HTML views, PDF and ePub downloads, according to the available data) and Abstracts Views on Vision4Press platform.
Data correspond to usage on the plateform after 2015. The current usage metrics is available 48-96 hours after online publication and is updated daily on week days.
Initial download of the metrics may take a while.