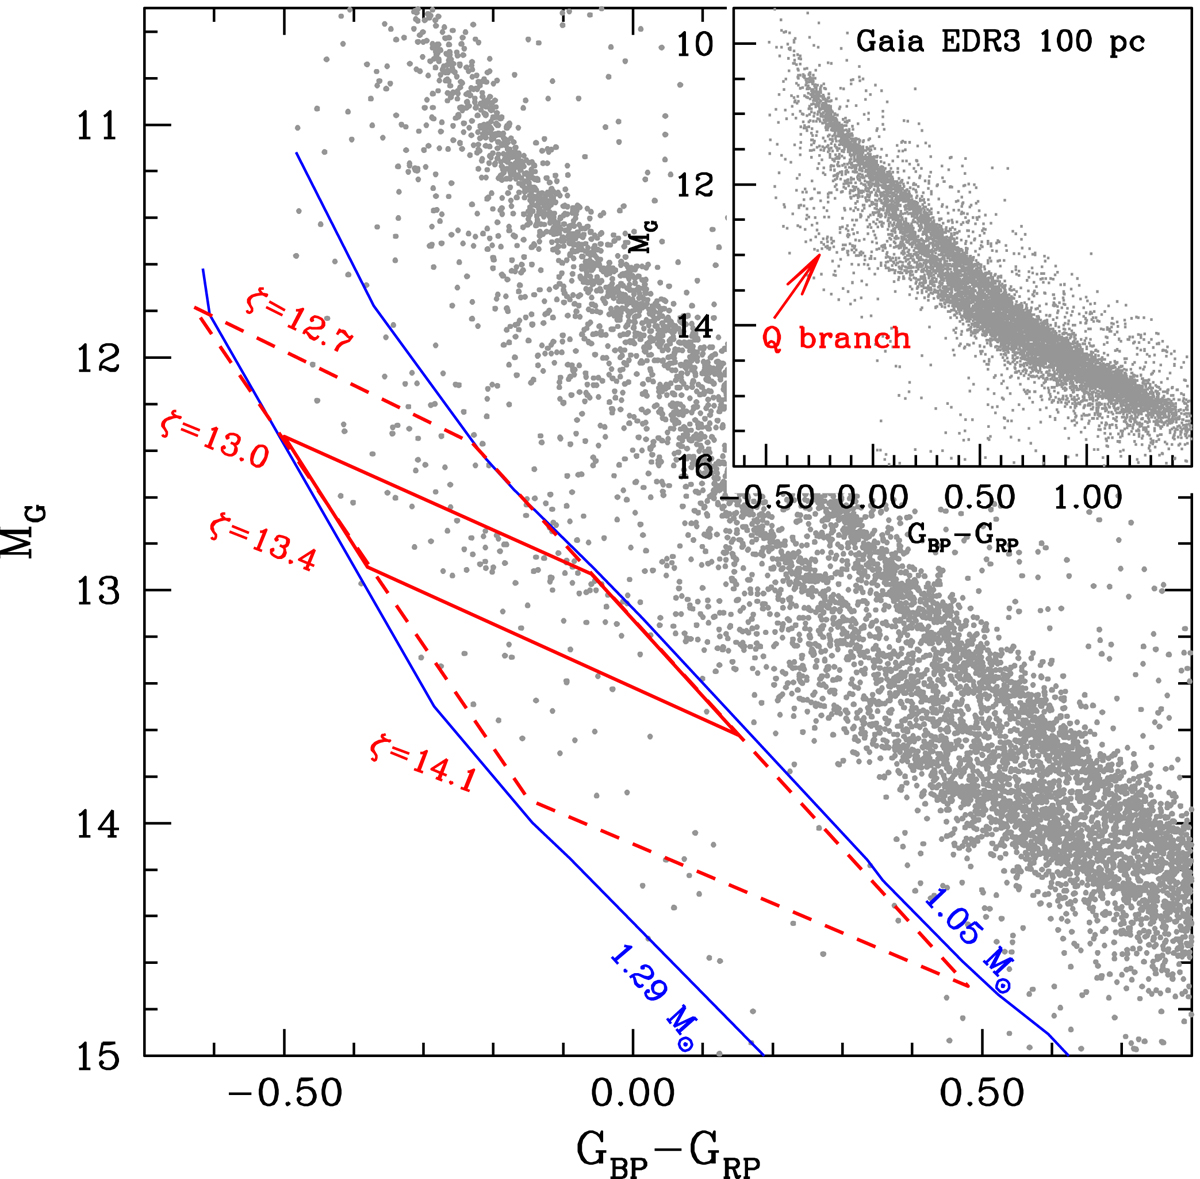
Fig. 1.

WD sequence (grey points) in the Gaia Hertzsprung-Russell diagram. Theoretical ONe-core WD cooling tracks of 1.05 and 1.29 M⊙ disregarding 22Ne diffusion are shown as solid blue lines (Camisassa et al. 2019). The Q branch is represented as an observed overabundance of WDs below the standard cooling sequence. In order to mark off the Q branch, we have defined the parameter ζ = MG − 1.2 × (GBP − GRP). The ultramassive Q branch is delimited by ζ = 13.4 and ζ = 13.0, and by the cooling tracks of 1.05 and 1.29 M⊙. Dashed red lines delimit the region where we have counted WDs to prepare the histograms.
Current usage metrics show cumulative count of Article Views (full-text article views including HTML views, PDF and ePub downloads, according to the available data) and Abstracts Views on Vision4Press platform.
Data correspond to usage on the plateform after 2015. The current usage metrics is available 48-96 hours after online publication and is updated daily on week days.
Initial download of the metrics may take a while.


