Free Access
Fig. A.1
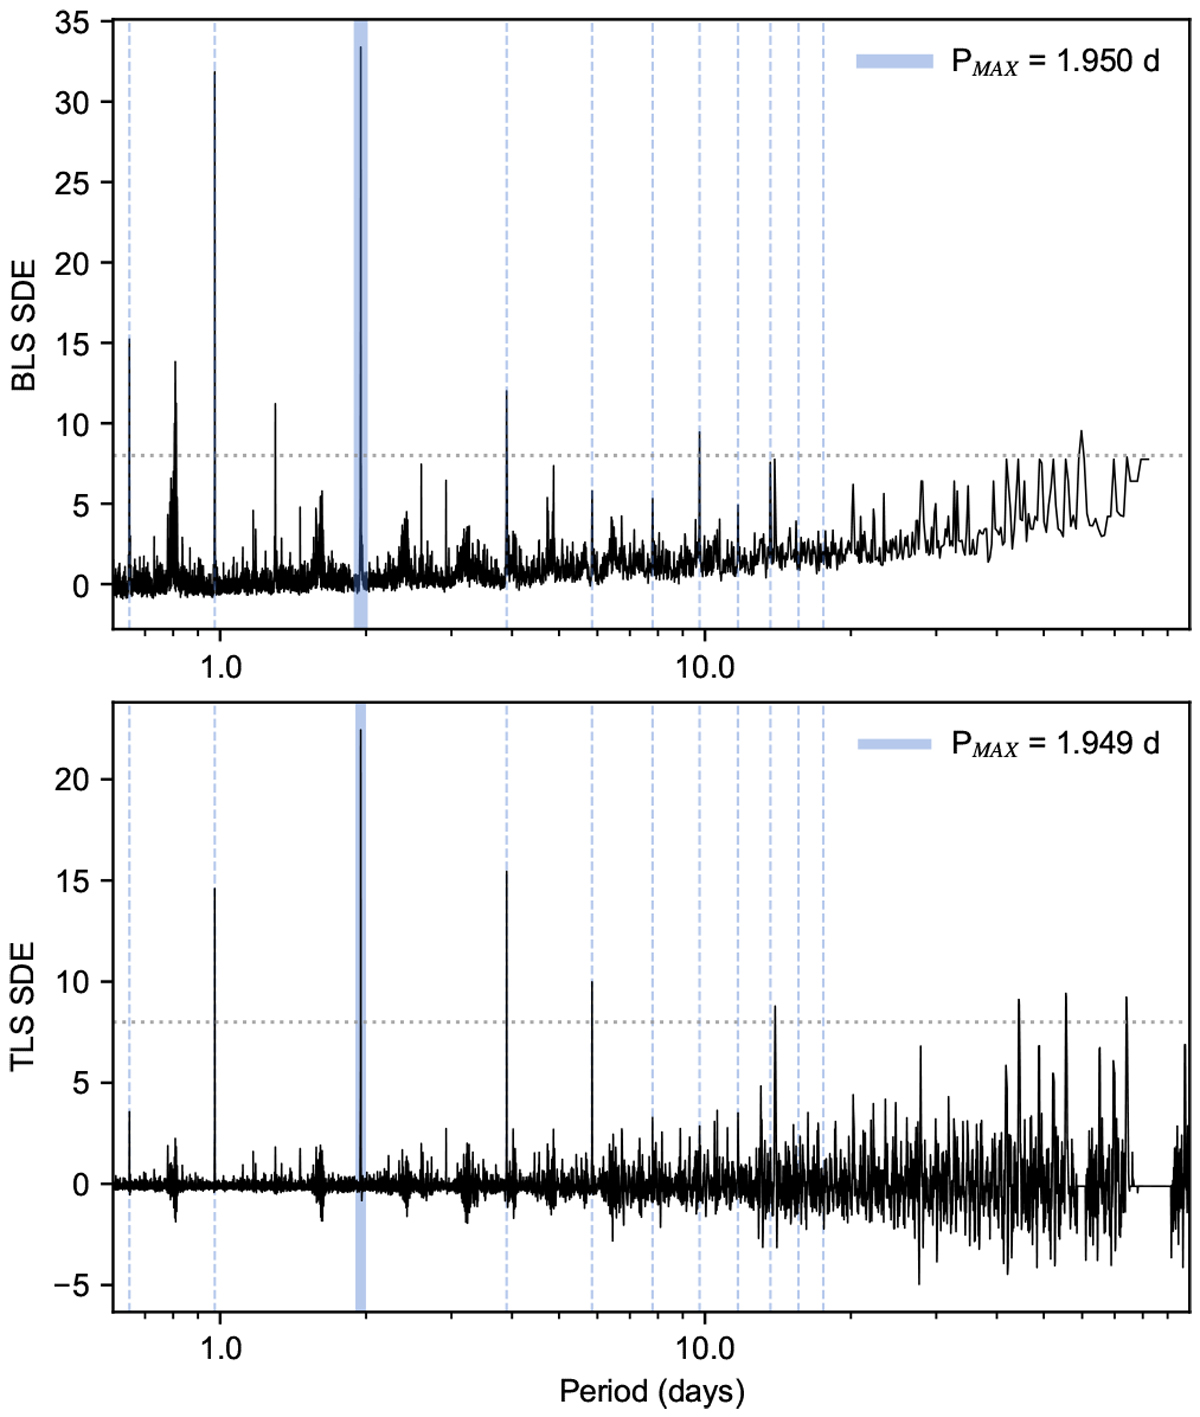
BLS (top panel) and TLS (bottom panel) SDE for the TESS light curve. The vertical blue lines correspond to aliases of the maximum period, highlighted by the blue shaded region. The dashed horizontal line at SDE = 8 in both panels corresponds to the threshold for transit detection from Aigrain et al. (2016).
Current usage metrics show cumulative count of Article Views (full-text article views including HTML views, PDF and ePub downloads, according to the available data) and Abstracts Views on Vision4Press platform.
Data correspond to usage on the plateform after 2015. The current usage metrics is available 48-96 hours after online publication and is updated daily on week days.
Initial download of the metrics may take a while.