Fig. 4
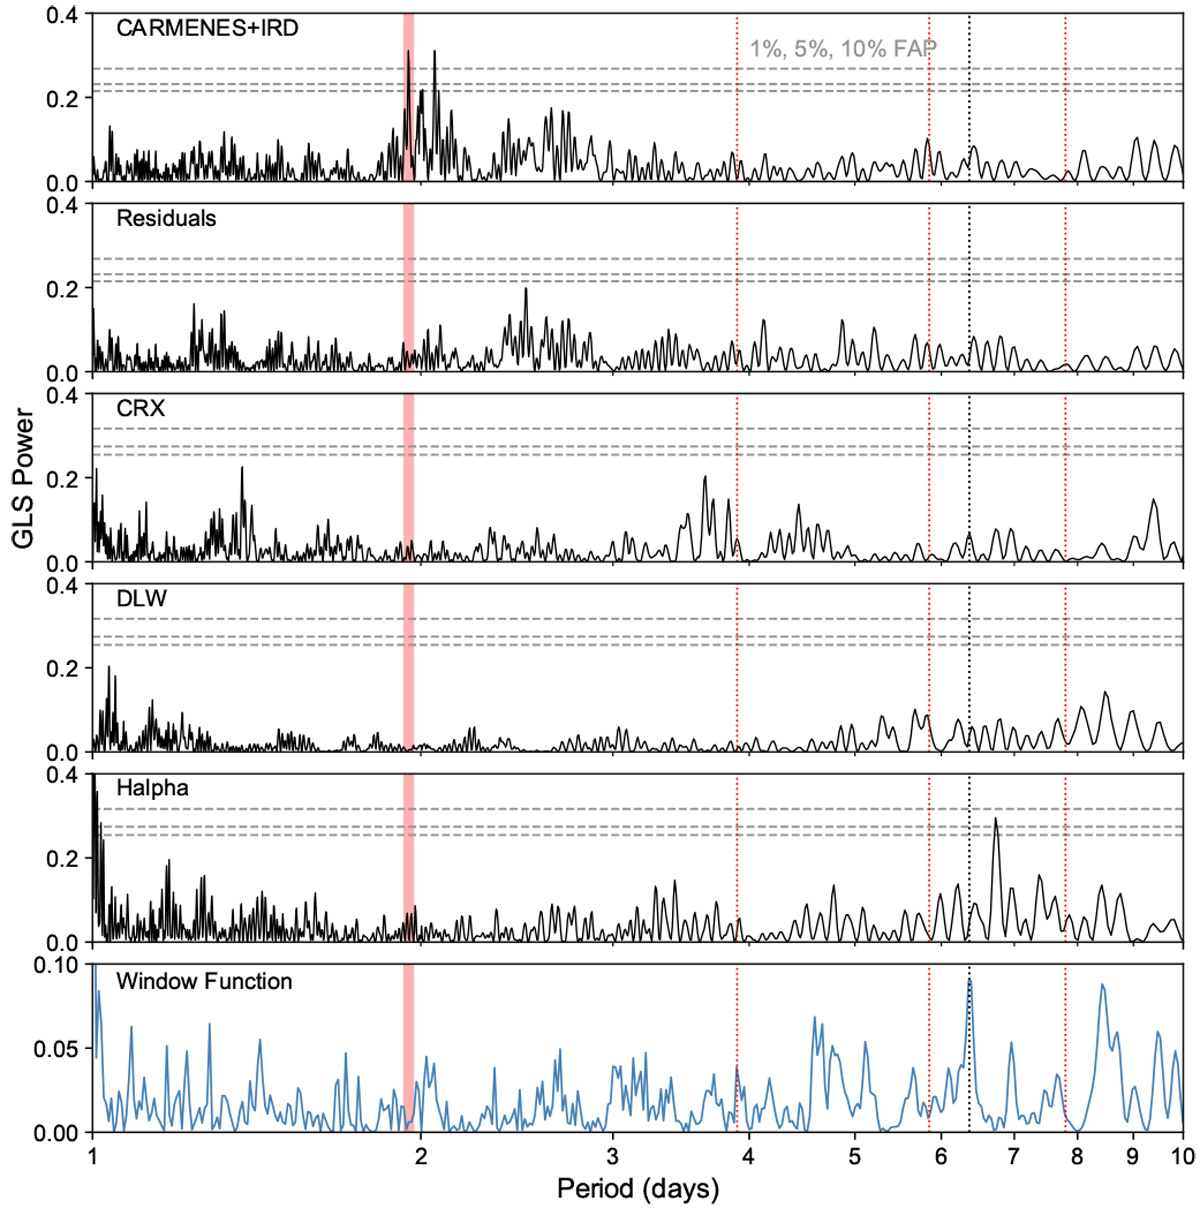
GLS periodograms for the combined RVs, RV residuals from the fit, the activity indices CRX, dLW, and Hα, and the window function. The dotted horizontal lines represent the 1, 5, and 10% FAP. The red shaded area is the position of the orbital period of the planet, and the vertical dotted red lines are aliases of that period. The vertical dotted black line represents the 6.4 d stellar rotation period by Newton et al. (2016).
Current usage metrics show cumulative count of Article Views (full-text article views including HTML views, PDF and ePub downloads, according to the available data) and Abstracts Views on Vision4Press platform.
Data correspond to usage on the plateform after 2015. The current usage metrics is available 48-96 hours after online publication and is updated daily on week days.
Initial download of the metrics may take a while.