Free Access
Fig. A.3
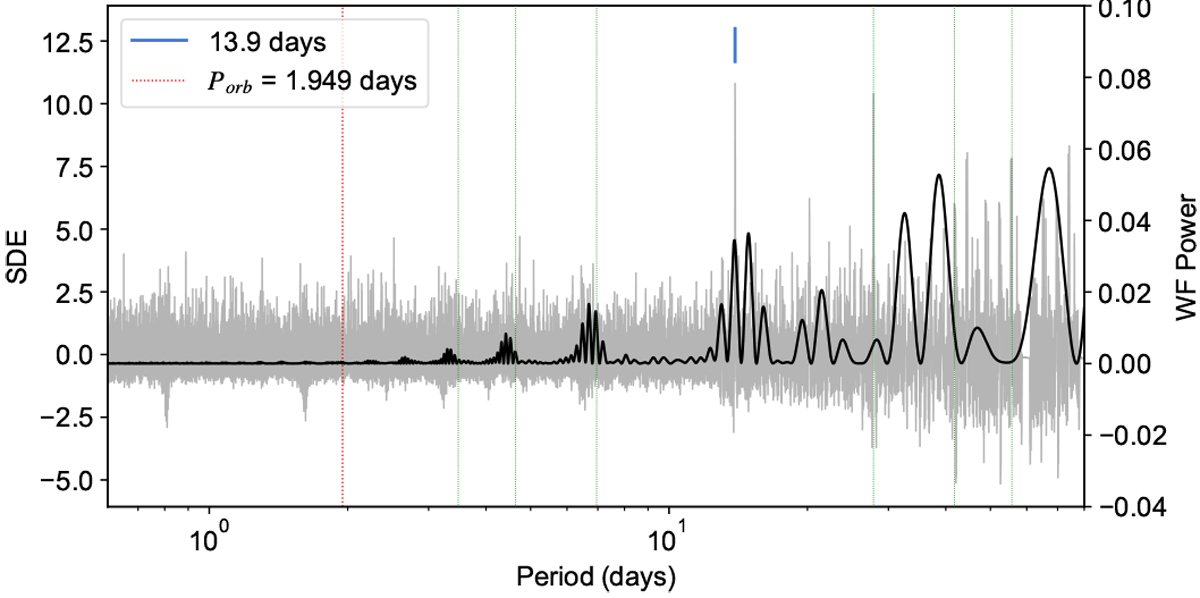
TLS of the TESS light curve residuals after subtracting the GP-plus-transit model. The dashed green lines are the aliases of the 13.9 d signal. The black line represents the window function of the data.
Current usage metrics show cumulative count of Article Views (full-text article views including HTML views, PDF and ePub downloads, according to the available data) and Abstracts Views on Vision4Press platform.
Data correspond to usage on the plateform after 2015. The current usage metrics is available 48-96 hours after online publication and is updated daily on week days.
Initial download of the metrics may take a while.