Fig. 1.
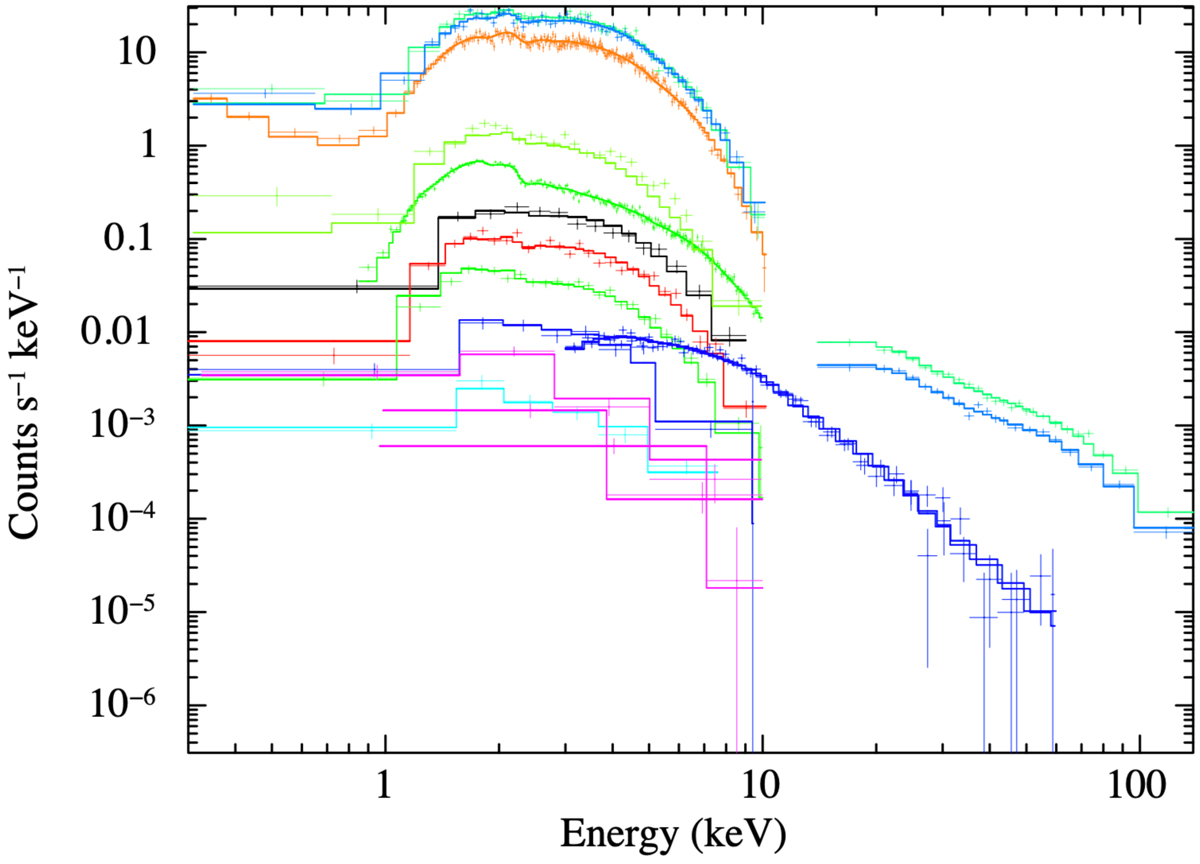
Fit of the spectral data. Data were heavily re-binned for display purposes. From top to bottom, spectra are shown in order of increasing time and decreasing flux. Spectra, as numbered in Table 2, are plotted in green and cyan (1), blue and cyan (2), orange (3), yellow and green (4), black (5), red (6), green (7), blue (8), light blue (9), and magenta (10).
Current usage metrics show cumulative count of Article Views (full-text article views including HTML views, PDF and ePub downloads, according to the available data) and Abstracts Views on Vision4Press platform.
Data correspond to usage on the plateform after 2015. The current usage metrics is available 48-96 hours after online publication and is updated daily on week days.
Initial download of the metrics may take a while.