Fig. 1.
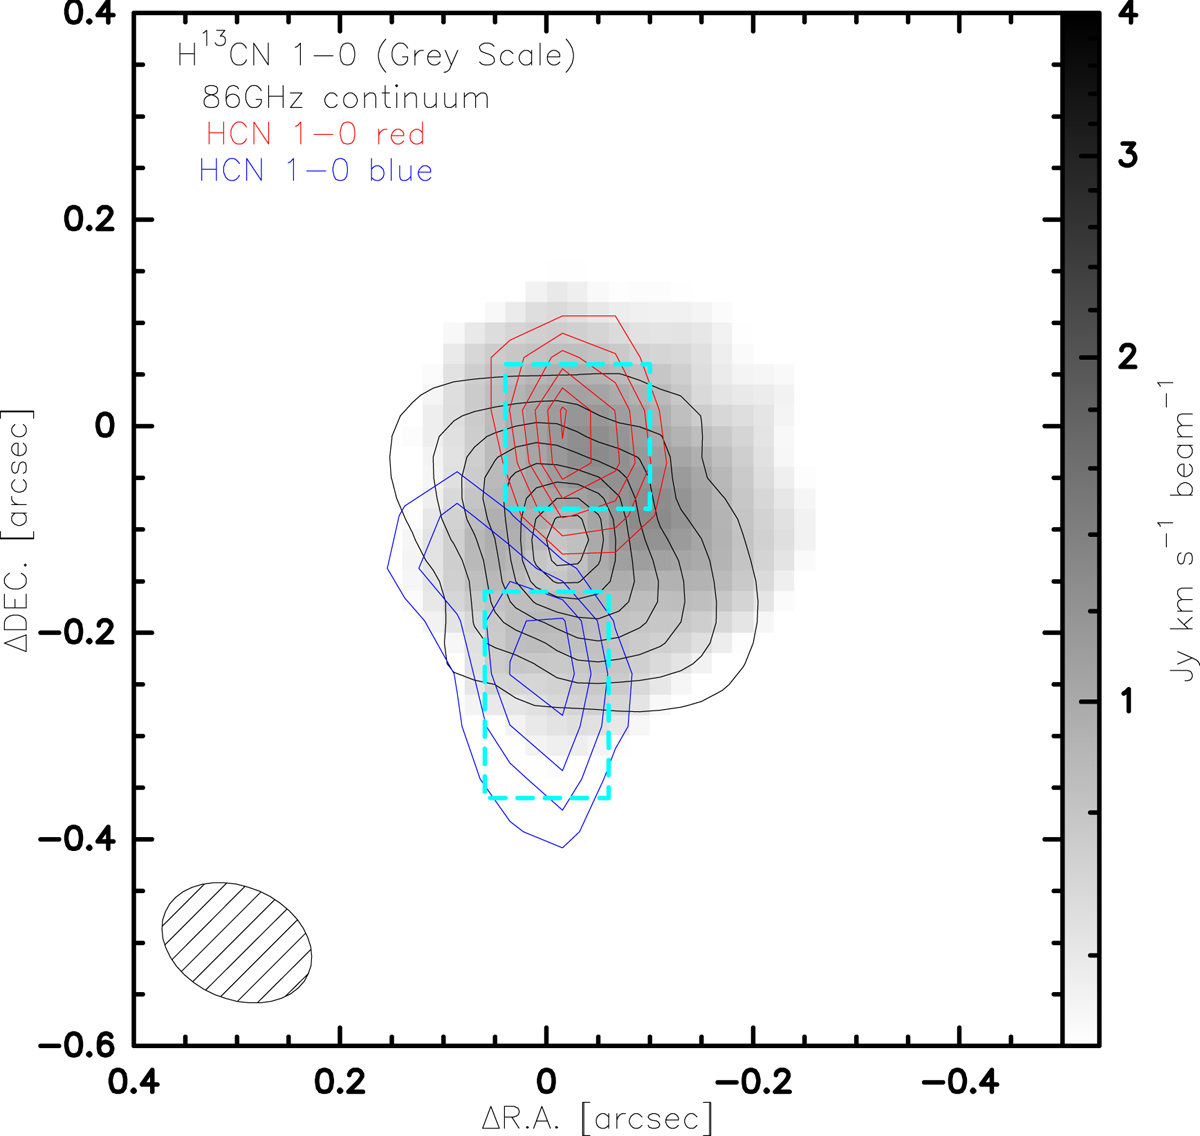
86 GHz continuum (black contour with levels starting from 3 mJy beam−1 in steps of 1 mJy beam−1), a velocity integrated map of H13CN 1−0 (grey scale, in units of Jy km s−1 beam−1), a velocity integrated map of HCN 1−0 red wing (red contour with levels starting from 0.2 Jy km s−1 beam−1 in steps of 0.05 Jy km s−1 beam−1) and a velocity integrated map of HCN 1−0 blue wing (blue contour with levels starting from 0.2 Jy km s−1 beam−1 in steps of 0.05 Jy km s−1 beam−1), around the centre of Arp 220 west. The dashed cyan boxes are the regions for the spectra in Figs. 2 and 3. The restoring beam (0.151″ × 0.109″, PA = 23.4°) of the data cube is shown in the bottom left. The central coordinates of this map are RA: 15:34:57.22 and Dec: 23:30:11.6 (J2000).
Current usage metrics show cumulative count of Article Views (full-text article views including HTML views, PDF and ePub downloads, according to the available data) and Abstracts Views on Vision4Press platform.
Data correspond to usage on the plateform after 2015. The current usage metrics is available 48-96 hours after online publication and is updated daily on week days.
Initial download of the metrics may take a while.