Fig. 3.
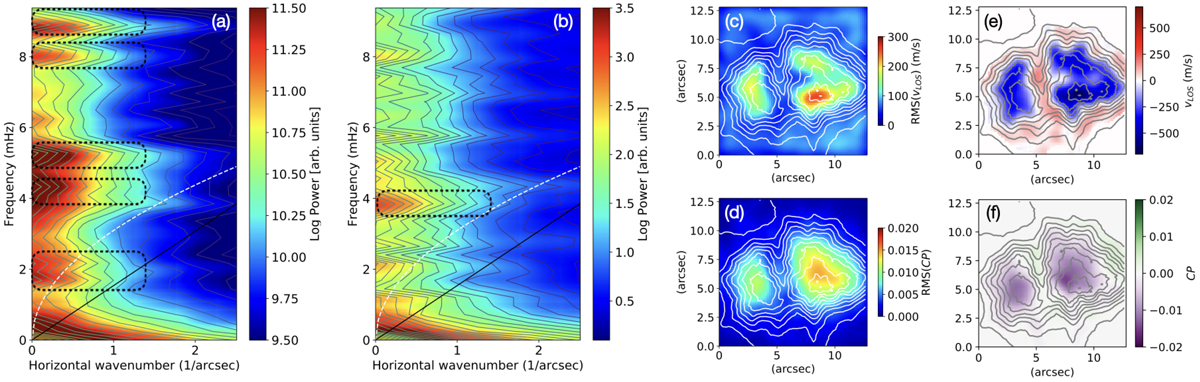
k − ω diagrams of the LoS velocity (panel a) and CP (panel b). The dashed white line represents the acoustic theoretical fundamental mode (gk, where g is the gravitational acceleration and k the horizontal wavenumber), while the continuous black line corresponds to the Lamb line and shows the theoretically expected propagation at the sound speed (csk, where cs is the sound speed). Panels c and d: RMS amplitude of the filtered velocity and CP, respectively. Panels e and f: filtered velocities and CP signals, respectively, at one instant in time. The filter widths (in both k and ω space) are illustrated by the dashed black boxes in panels a and b, where most of the power is located.
Current usage metrics show cumulative count of Article Views (full-text article views including HTML views, PDF and ePub downloads, according to the available data) and Abstracts Views on Vision4Press platform.
Data correspond to usage on the plateform after 2015. The current usage metrics is available 48-96 hours after online publication and is updated daily on week days.
Initial download of the metrics may take a while.