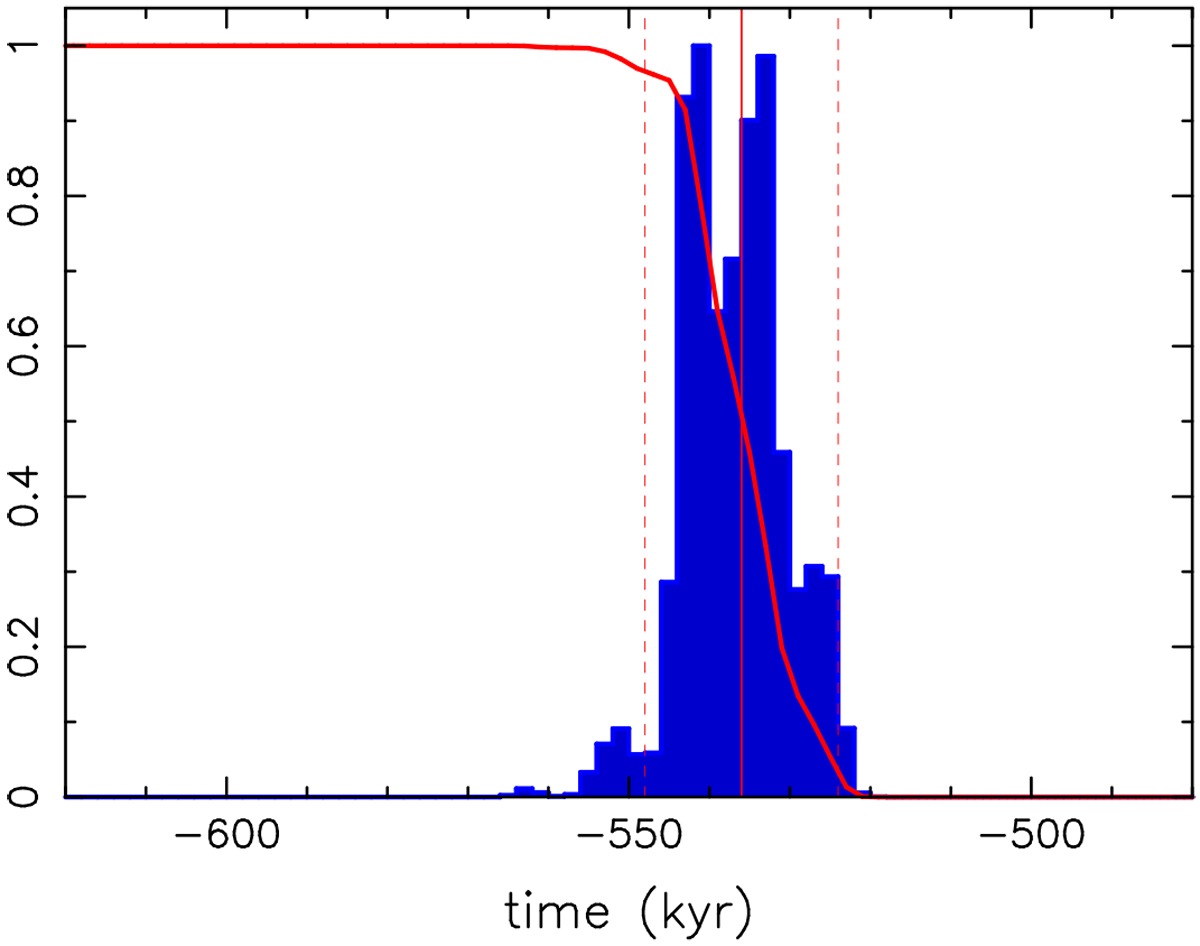
Fig. 7

Number of convergent solutions at the ΔV′≤ 6 m s−1 limit from the backward integration of six small members with Yarkovsky clones and the nominal orbit of (525) Adelaide. The blue histogram provides differential distribution using 2 kyr bins (maximum normalised to unity); the red curve is the respective cumulative distribution. The thin vertical red line shows the median epoch of the cumulative distribution, the vertical dashed lines are 5 and 95% limits. The time is at the abscissa to the past.
Current usage metrics show cumulative count of Article Views (full-text article views including HTML views, PDF and ePub downloads, according to the available data) and Abstracts Views on Vision4Press platform.
Data correspond to usage on the plateform after 2015. The current usage metrics is available 48-96 hours after online publication and is updated daily on week days.
Initial download of the metrics may take a while.


