Fig. 2
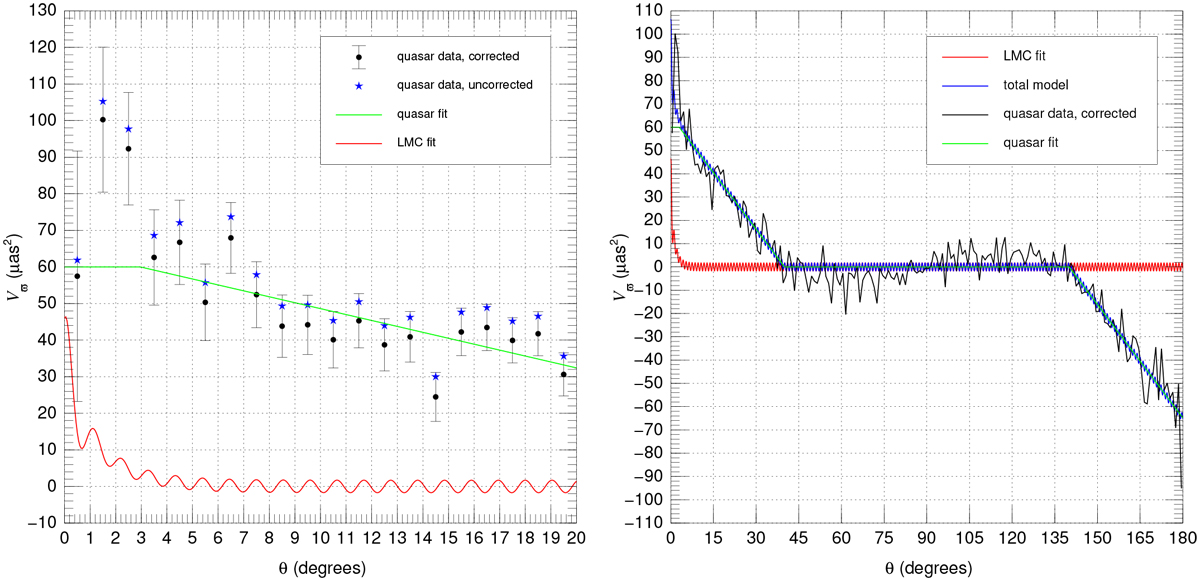
Large-angle angular covariance of the Gaia EDR3 parallaxes.Left panel: 0°–20° separation range with the quasar data in 1° bins using either ϖ (blue asterisks) or ϖc (black error bars), the linear fit to the quasar corrected data in the 5°–40° separation range (green line), and the analytical fit to the LMC data (red line). The error bars associated with the quasar ϖ data are not shown, but they are similar to those for ϖc. Right panel: full 0°–180° separation range and includes the total quasar+LMC model.
Current usage metrics show cumulative count of Article Views (full-text article views including HTML views, PDF and ePub downloads, according to the available data) and Abstracts Views on Vision4Press platform.
Data correspond to usage on the plateform after 2015. The current usage metrics is available 48-96 hours after online publication and is updated daily on week days.
Initial download of the metrics may take a while.