Fig. 1
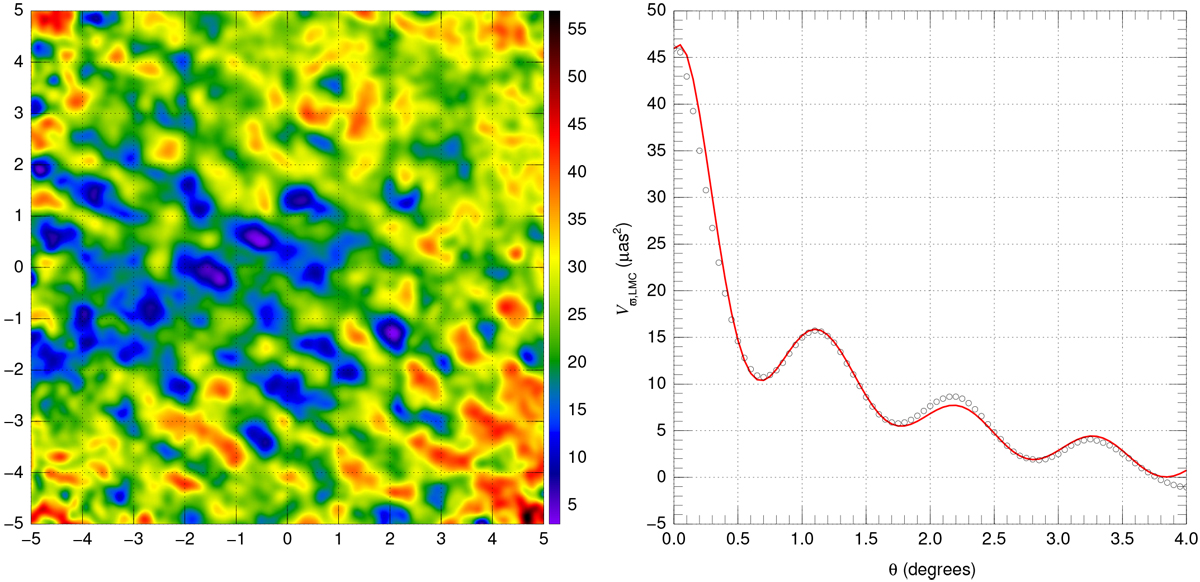
Left: smoothed corrected Gaia EDR3 parallaxes for the bright LMC subsample. The axes arerectangular coordinates in degrees and the color table shows the parallax scale in μas. Right: angular covariance in the LMC data with respect to the mean measured parallax. The points are the measured values and the red line is the analytical function described in the text.
Current usage metrics show cumulative count of Article Views (full-text article views including HTML views, PDF and ePub downloads, according to the available data) and Abstracts Views on Vision4Press platform.
Data correspond to usage on the plateform after 2015. The current usage metrics is available 48-96 hours after online publication and is updated daily on week days.
Initial download of the metrics may take a while.