Fig. 7.
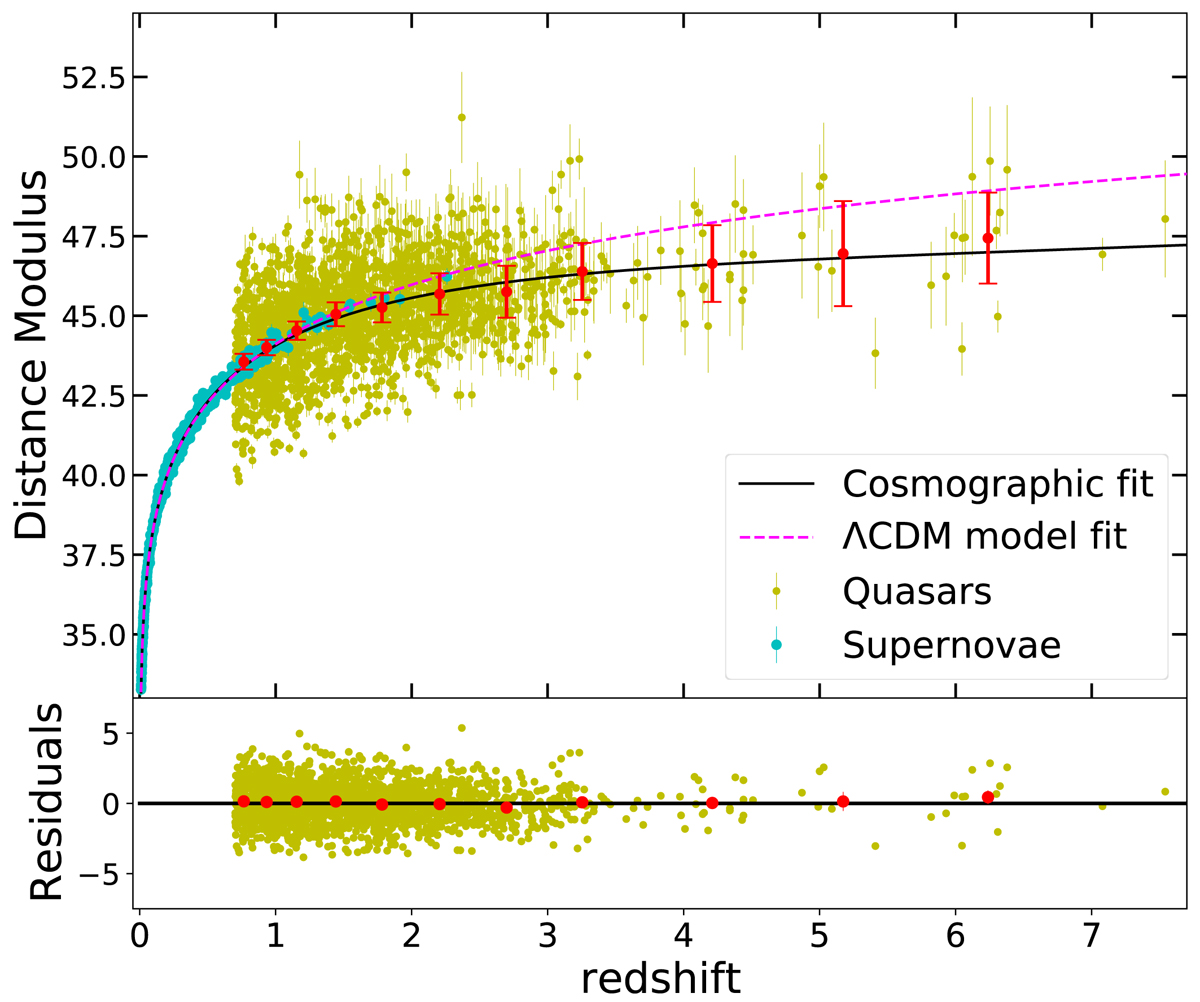
Top panel: hubble diagram of SNe (cyan points) and quasars (yellow points). The red points are averages (along with their uncertainties) of the distance moduli of quasars in narrow (logarithmic) redshift intervals and they are shown for visualization purposes only, without any statistical application. Dashed magenta and continuous black lines show respectively the best-fit curves of the flat ΛCDM and the logarithmic models over the whole redshift range. Bottom panel: residuals with respect to the cosmographic fit for quasars and averages of the residuals over the same redshift intervals.
Current usage metrics show cumulative count of Article Views (full-text article views including HTML views, PDF and ePub downloads, according to the available data) and Abstracts Views on Vision4Press platform.
Data correspond to usage on the plateform after 2015. The current usage metrics is available 48-96 hours after online publication and is updated daily on week days.
Initial download of the metrics may take a while.