Fig. 8.
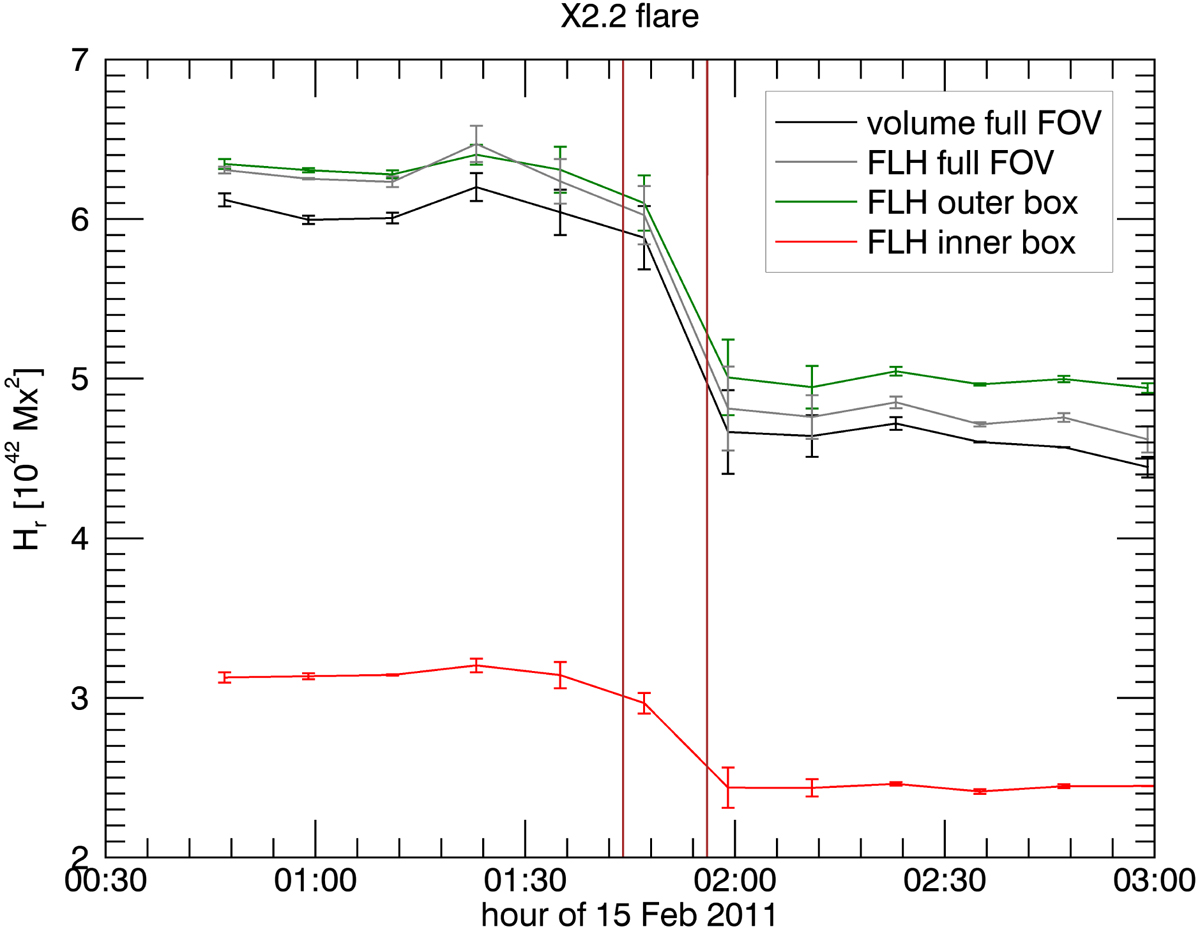
Evolution of relative helicities in AR 11158 during a two-hour interval centred on the X2.2 flare. Shown are the relative helicities as calculated by the volume method (Eq. (1), black line), and by the RFLH method using Eq. (9) in the whole AR (grey line) and in the two boxes of Fig. 6 (red and green lines). The error bars are computed from the difference of the curves from their five-point moving averages. The vertical lines denote the onset and peak times of the X-class flare.
Current usage metrics show cumulative count of Article Views (full-text article views including HTML views, PDF and ePub downloads, according to the available data) and Abstracts Views on Vision4Press platform.
Data correspond to usage on the plateform after 2015. The current usage metrics is available 48-96 hours after online publication and is updated daily on week days.
Initial download of the metrics may take a while.