Fig. 6.
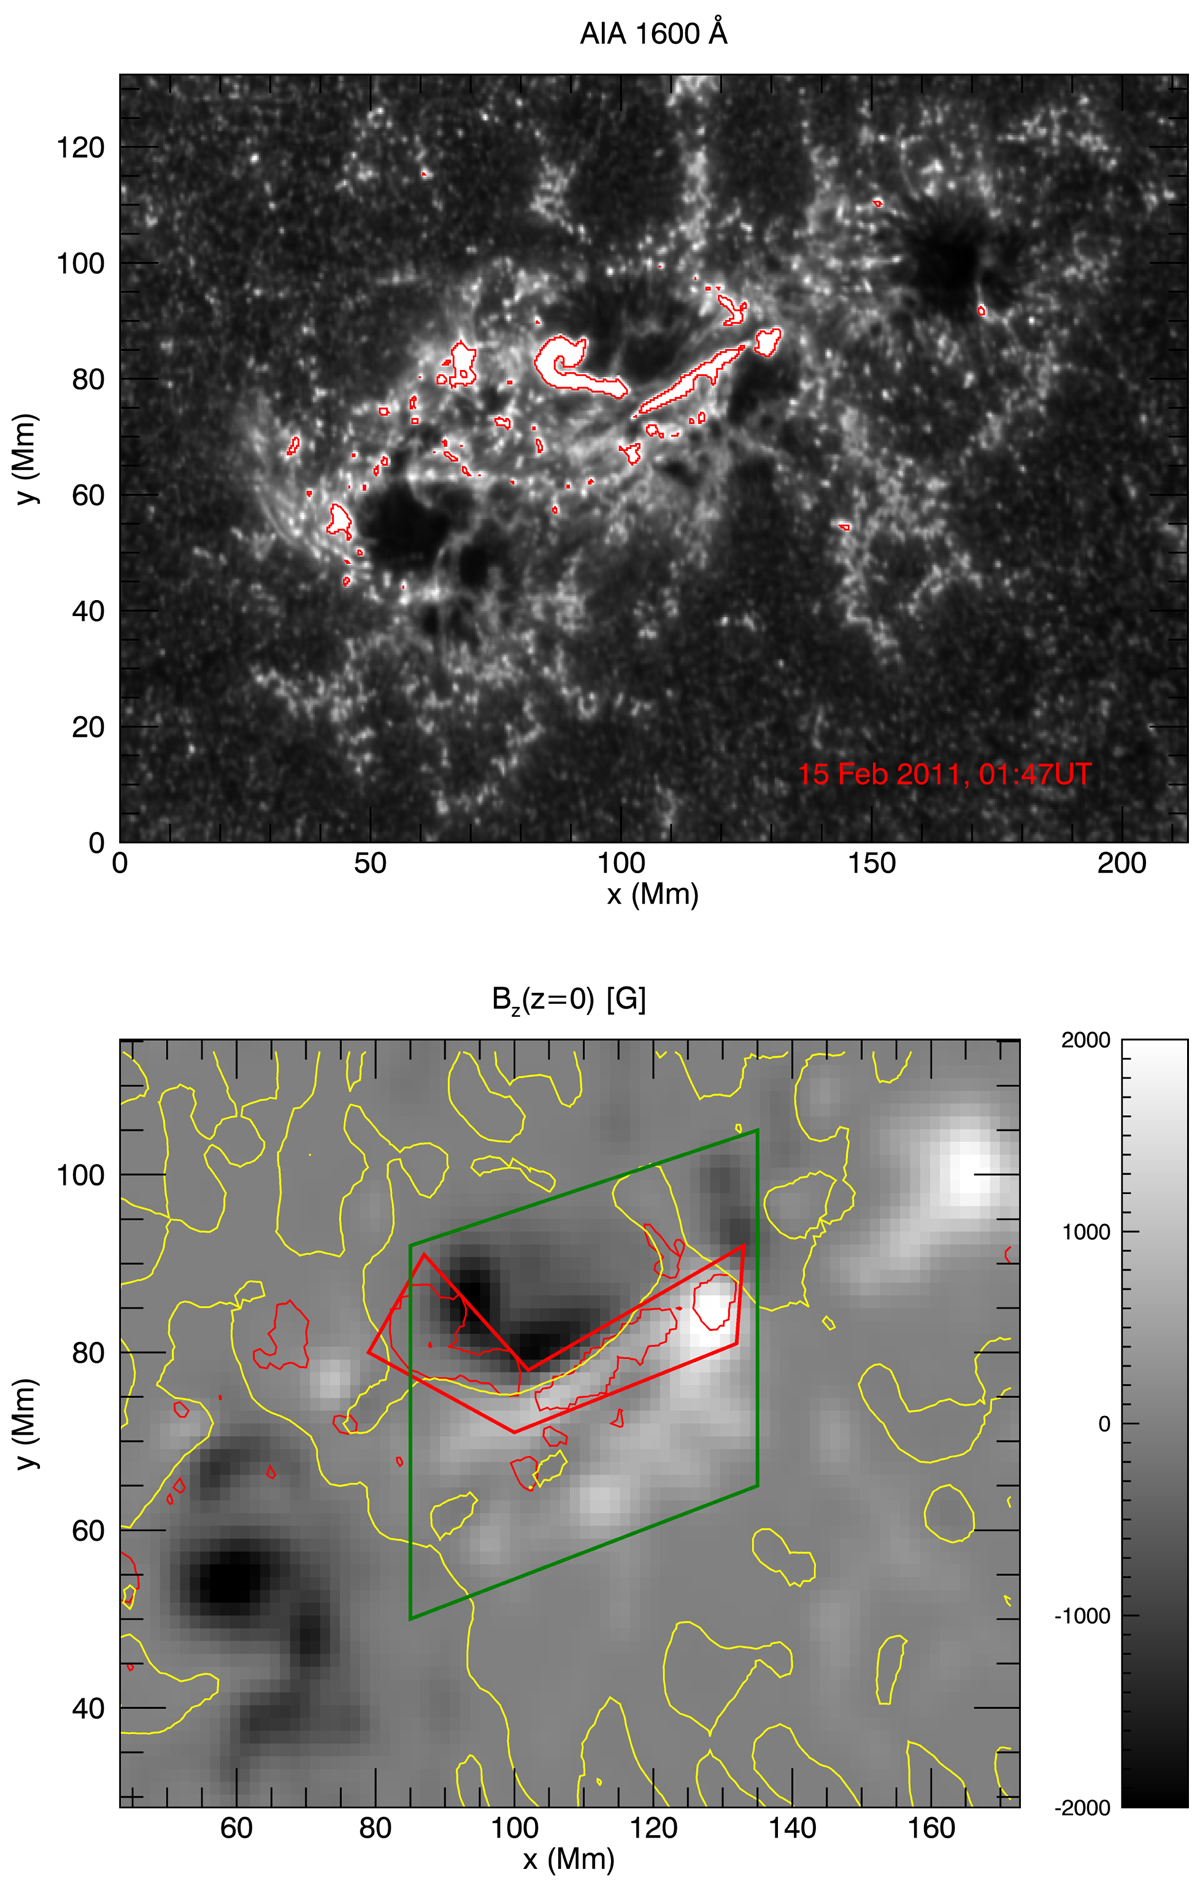
AIA image at 1600 Å of the same AR region shown in Fig. 3 saturated at the intensity of 1180 and overplotted with the contours at the same value at the beginning of the X2.2 flare of AR 11158 (top). Zoom of the vertical magnetic field 2D map at the same time, with the two regions of interest (bottom). Red contours are the same as in the top panel, only rebinned to the resolution of the magnetic field image. Yellow contours correspond to the magnetic field value Bz = 0 G.
Current usage metrics show cumulative count of Article Views (full-text article views including HTML views, PDF and ePub downloads, according to the available data) and Abstracts Views on Vision4Press platform.
Data correspond to usage on the plateform after 2015. The current usage metrics is available 48-96 hours after online publication and is updated daily on week days.
Initial download of the metrics may take a while.