Free Access
Fig. 3.
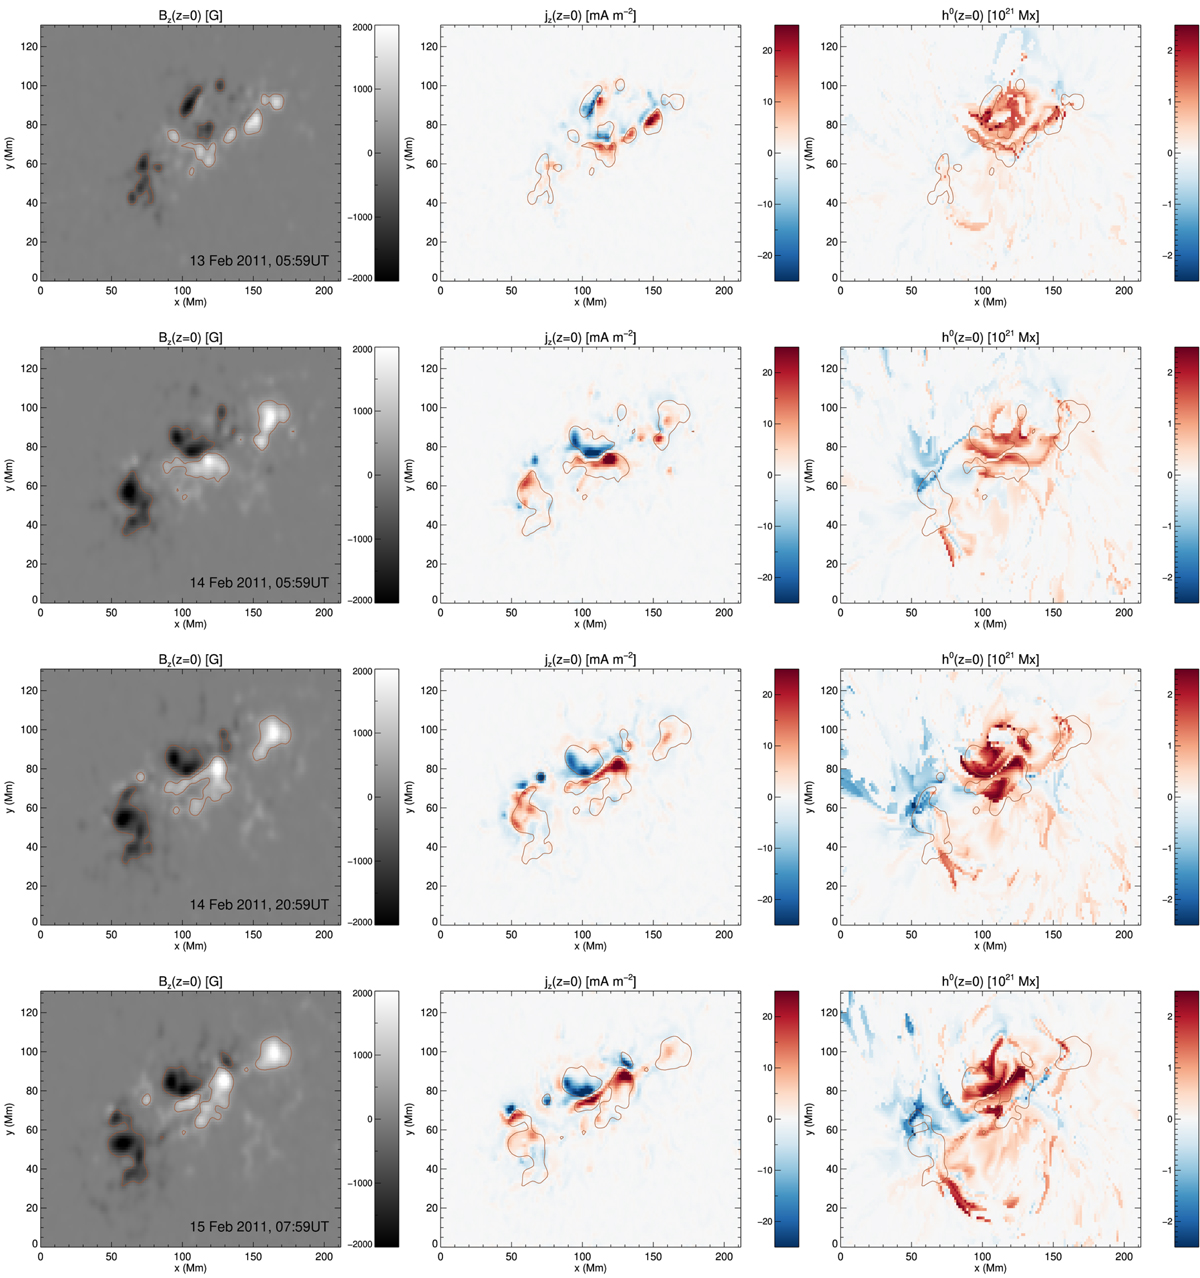
Photospheric maps of vertical magnetic field, Bz (left), vertical electrical current, jz (middle), and RFLH (right) in AR 11158 for four snapshots during the studied interval. The red contours correspond to the vertical magnetic field values |Bz| = 500 G at each instant.
Current usage metrics show cumulative count of Article Views (full-text article views including HTML views, PDF and ePub downloads, according to the available data) and Abstracts Views on Vision4Press platform.
Data correspond to usage on the plateform after 2015. The current usage metrics is available 48-96 hours after online publication and is updated daily on week days.
Initial download of the metrics may take a while.