Free Access
Fig. 6
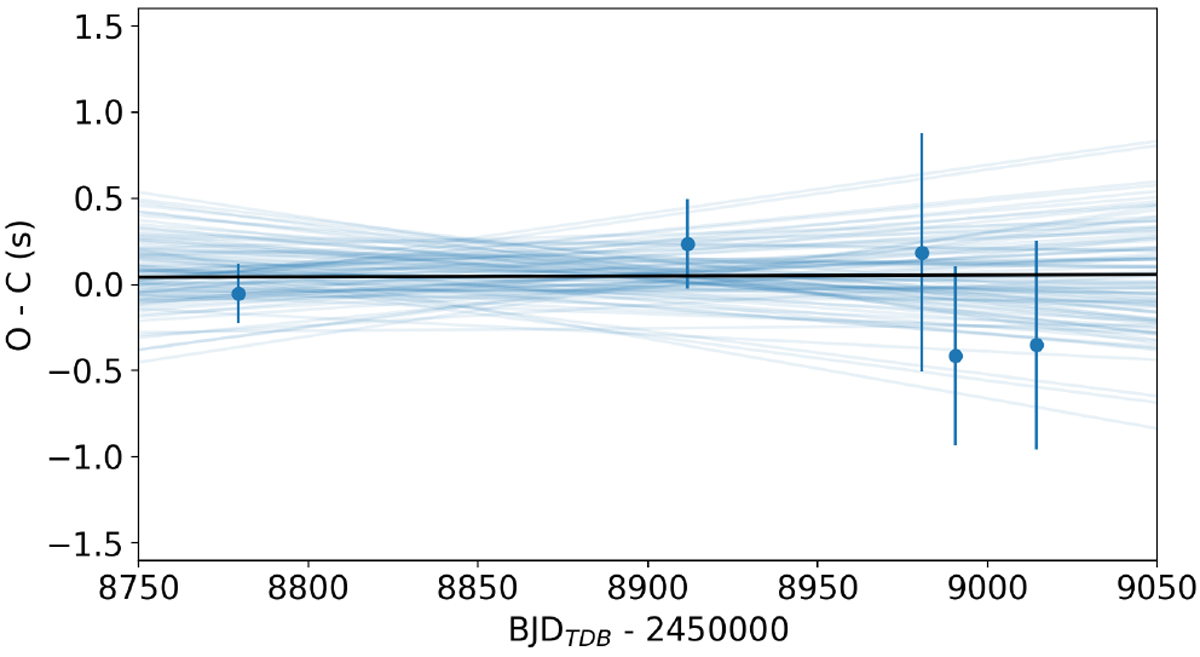
O–C values of the mid-transit times for which a precision of less than 1 s could be achieved. The lines are random samples of the posterior of a linear fit to these values.
Current usage metrics show cumulative count of Article Views (full-text article views including HTML views, PDF and ePub downloads, according to the available data) and Abstracts Views on Vision4Press platform.
Data correspond to usage on the plateform after 2015. The current usage metrics is available 48-96 hours after online publication and is updated daily on week days.
Initial download of the metrics may take a while.