Fig. 3
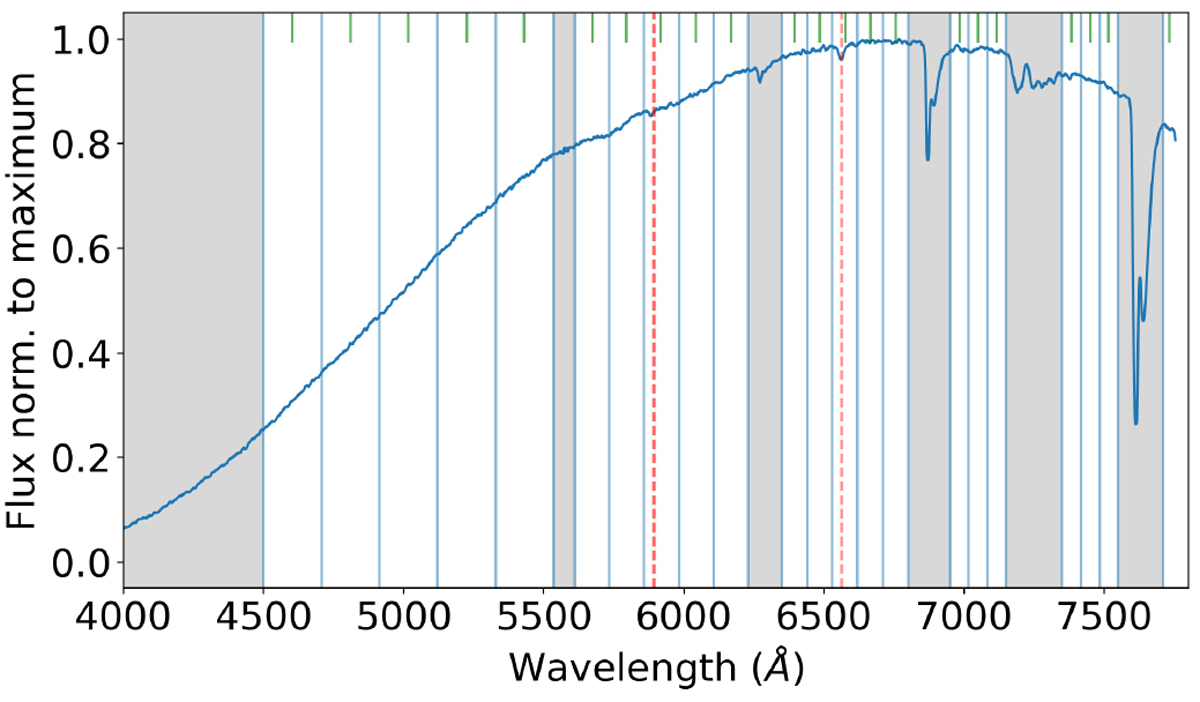
Average out-of-transit spectrum of WD 1856+534 with the wavelength bins used to compute the transmission spectrum. The limits of the bins are represented with vertical blue lines, and the central wavelengths of each bin are indicated at the top with short vertical green lines. The definition of the bins took the locations of the telluric absorption bands into account (marked with the grey bands; these are discarded), and narrower bins were used when the flux was higher. The positions of the Na I doublet and the Hα absorption line are marked with vertical dashed red lines.
Current usage metrics show cumulative count of Article Views (full-text article views including HTML views, PDF and ePub downloads, according to the available data) and Abstracts Views on Vision4Press platform.
Data correspond to usage on the plateform after 2015. The current usage metrics is available 48-96 hours after online publication and is updated daily on week days.
Initial download of the metrics may take a while.