Free Access
Fig. 2
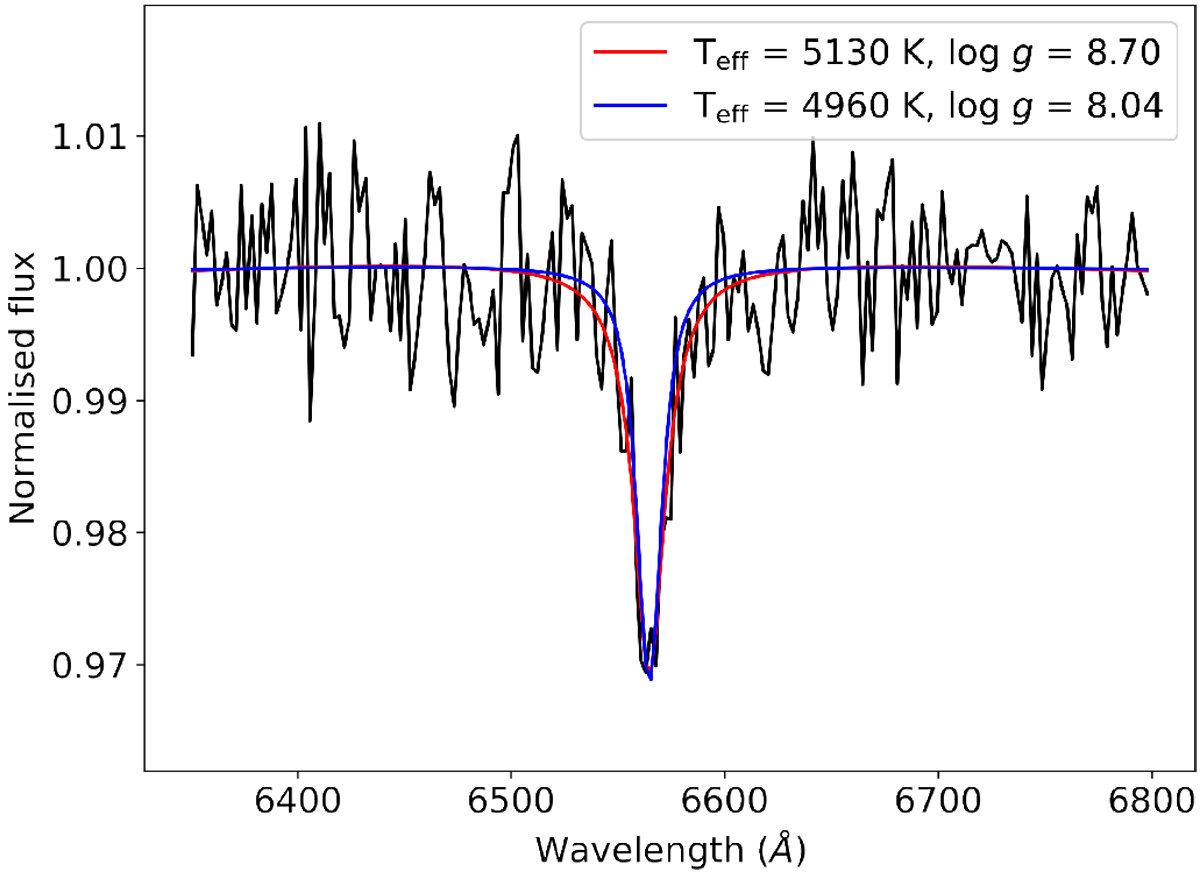
Average out-of-transit normalised spectrum of the night of May 20, 2020 centred at the Hα absorption line. The best-fit spectroscopic model of a DA WD is overplotted as a red line, and the model that best fits the photometric data as a blue line.
Current usage metrics show cumulative count of Article Views (full-text article views including HTML views, PDF and ePub downloads, according to the available data) and Abstracts Views on Vision4Press platform.
Data correspond to usage on the plateform after 2015. The current usage metrics is available 48-96 hours after online publication and is updated daily on week days.
Initial download of the metrics may take a while.