Fig. 1
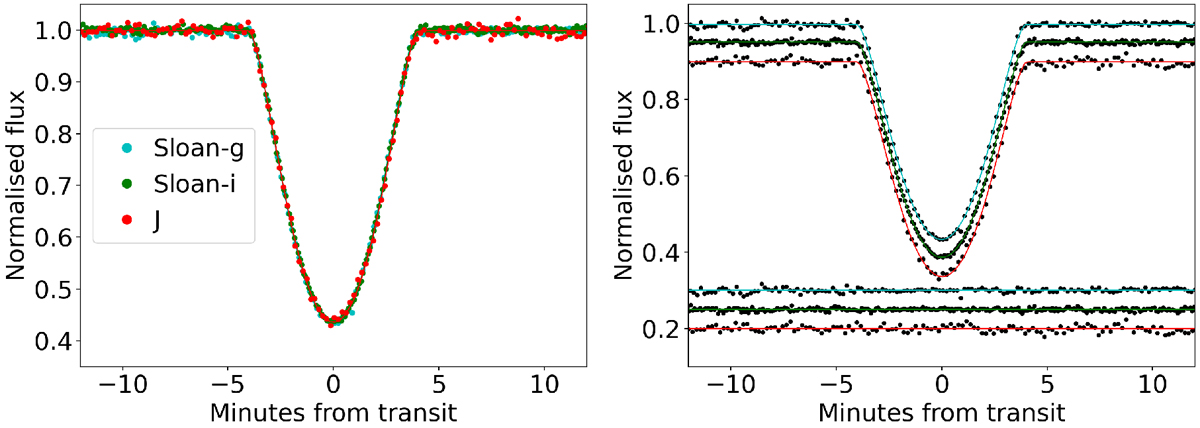
Light curves of WD 1856+534 obtained with GTC in three different filters. In the right panel, the curves are plotted introducing vertical offsets (to observe the cadence and precision of each of the datasets) and also show the residuals of the best-fit model. The dispersions of the residuals in each colour are 0.6, 0.4, and 0.9%, respectively.
Current usage metrics show cumulative count of Article Views (full-text article views including HTML views, PDF and ePub downloads, according to the available data) and Abstracts Views on Vision4Press platform.
Data correspond to usage on the plateform after 2015. The current usage metrics is available 48-96 hours after online publication and is updated daily on week days.
Initial download of the metrics may take a while.