Fig. 9.
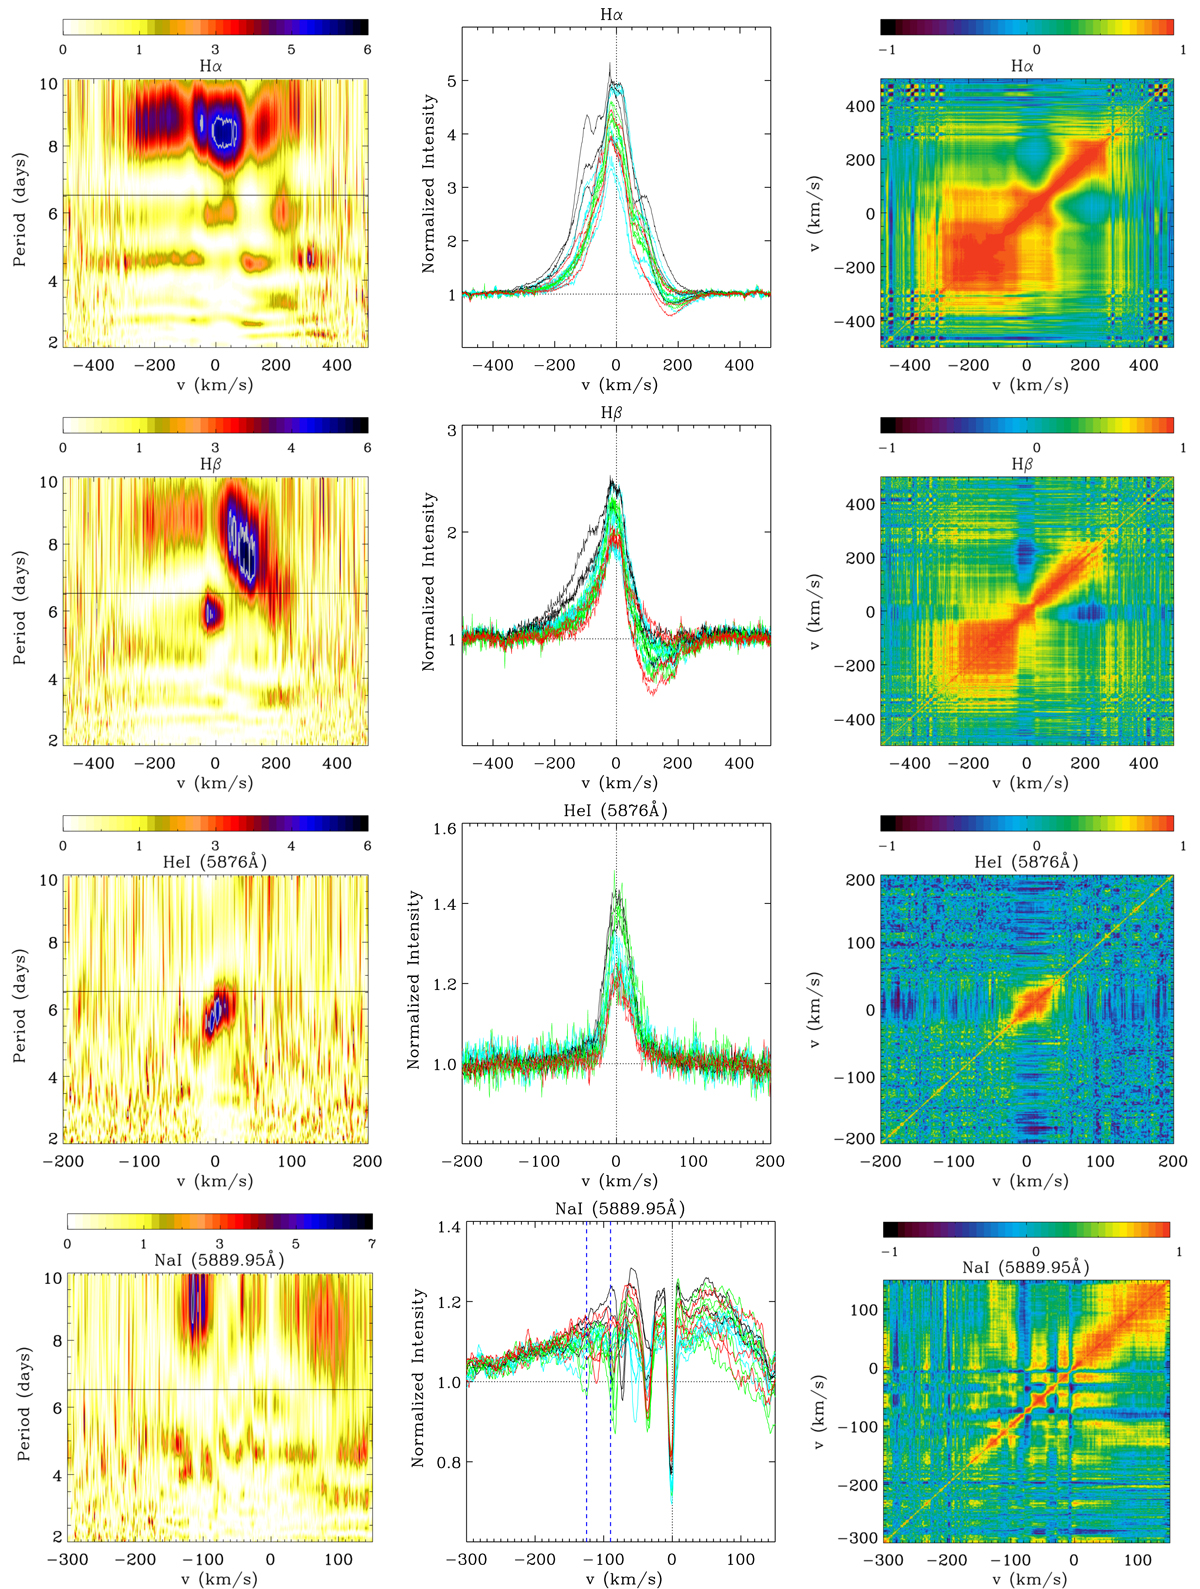
Time series analysis of circumstellar emission lines. Left: bidimensional periodograms. The color range corresponds to the power of the periodogram, and the horizontal line represents the star’s rotation period, P = 6.53 days. The white contour represents the FAP level of about 95% confidence. Middle: line profiles obtained with the ESPaDOnS and HARPS spectrographs. The colors correspond to different rotation cycles. The two blue vertical lines delimit the periodic region of the Na I line. Right: correlation matrices. The color range corresponds to the value of the linear correlation coefficient. Perfect anticorrelation corresponds to −1 (black), no correlation to 0 (light blue), and a perfect correlation to 1 (orange).
Current usage metrics show cumulative count of Article Views (full-text article views including HTML views, PDF and ePub downloads, according to the available data) and Abstracts Views on Vision4Press platform.
Data correspond to usage on the plateform after 2015. The current usage metrics is available 48-96 hours after online publication and is updated daily on week days.
Initial download of the metrics may take a while.