Fig. 4.
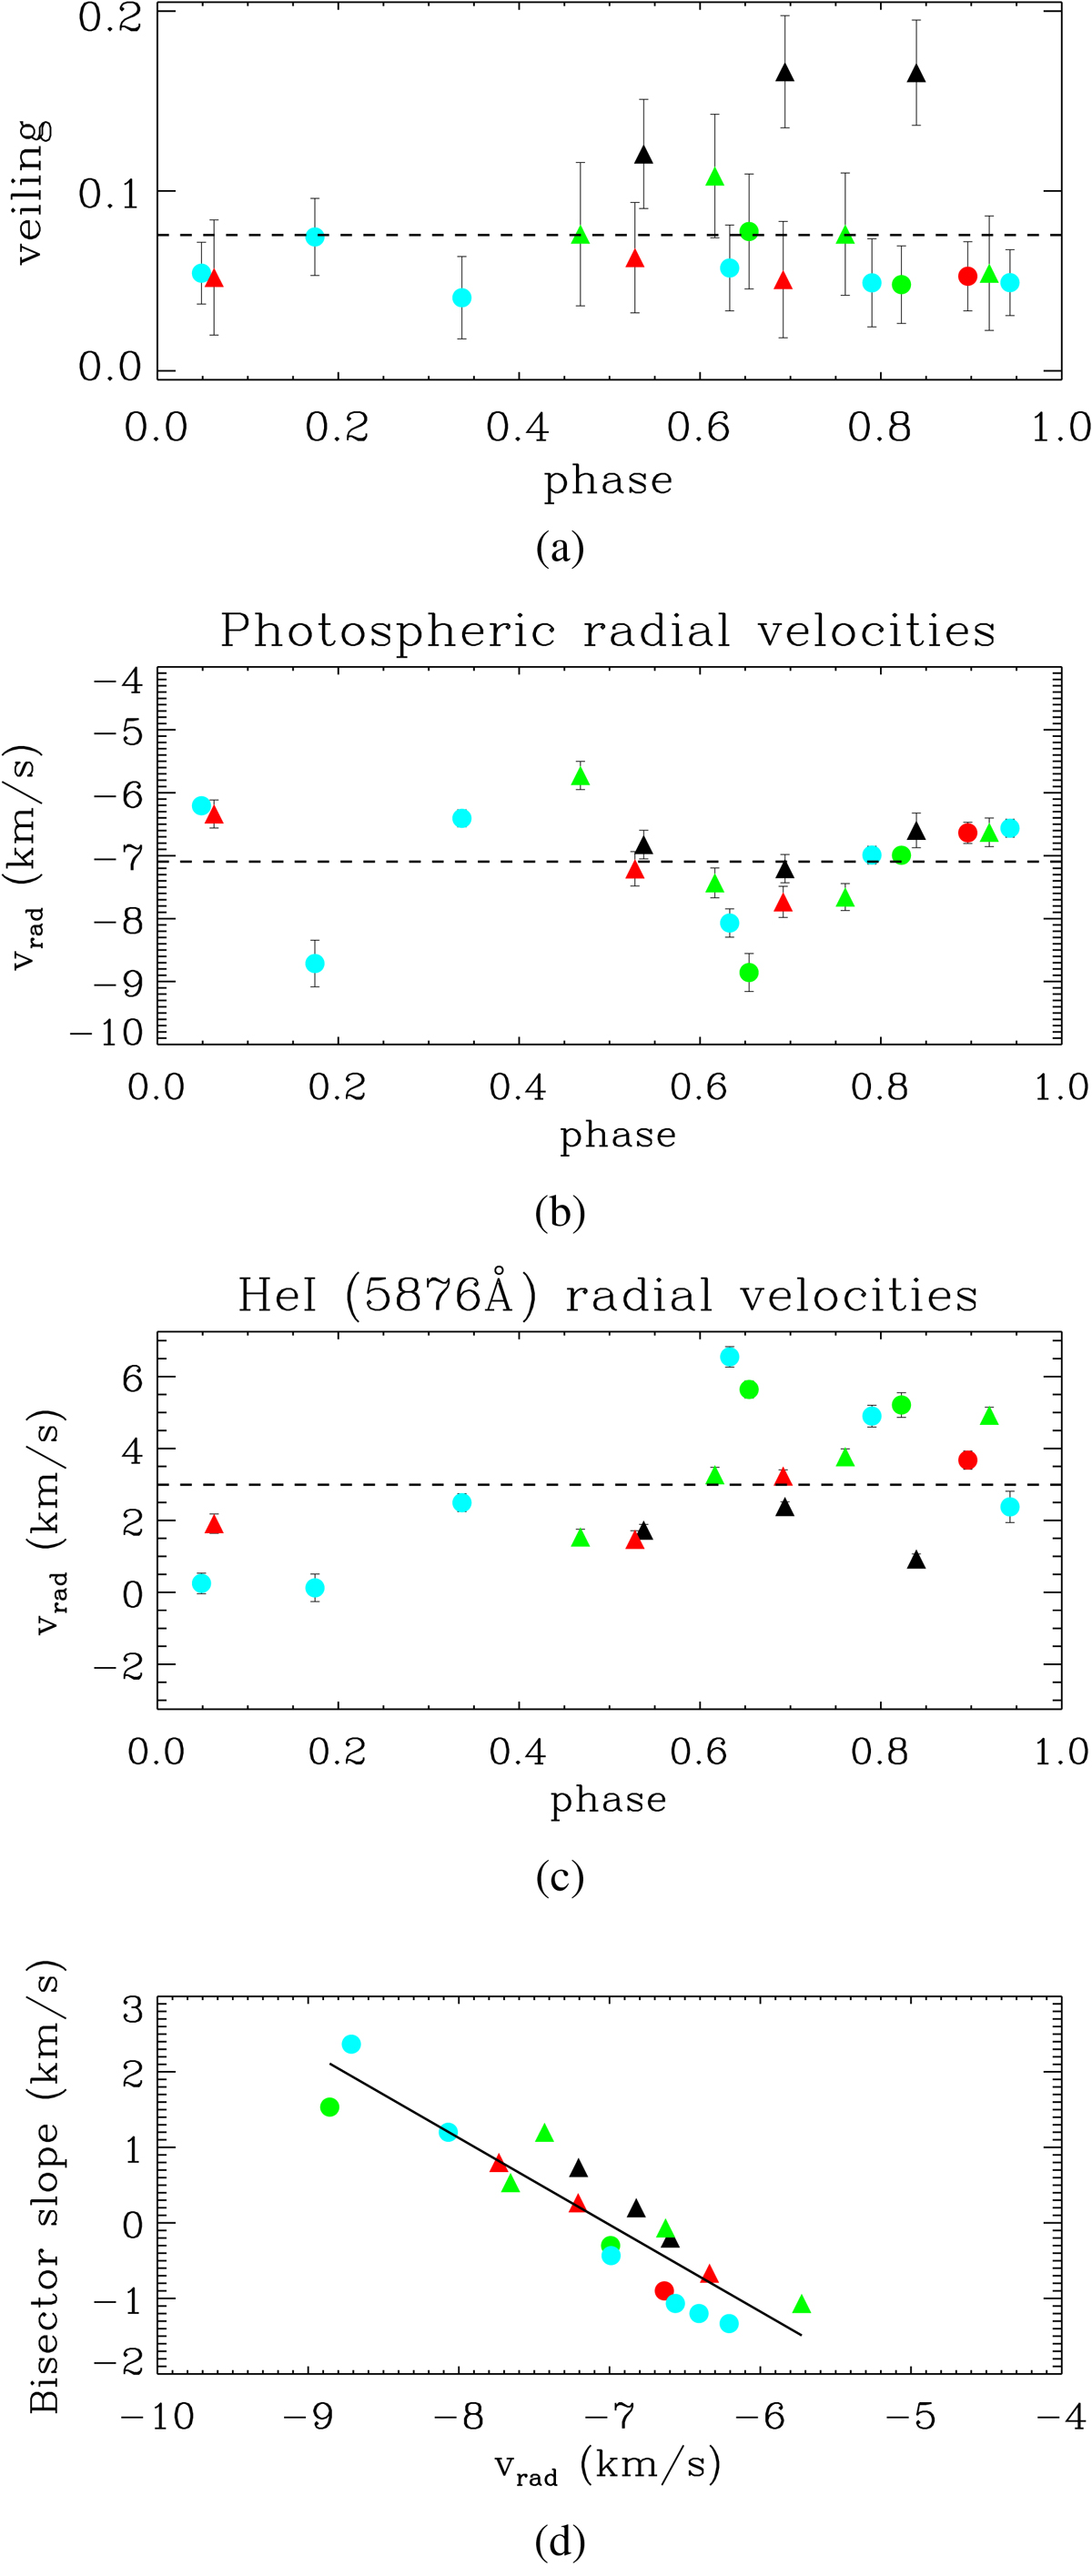
Veiling (a) and the radial velocity (b) of photospheric lines in phase with the ephemeris from Alencar et al. (2012) and Donati et al. (2007). The veiling and radial velocity correspond to mean values obtained from all spectroscopic regions used in the calculations. The error bars come from the standard deviations. (c) He I 5876 Å line radial velocities. (d) Bisector slope as a function of the radial velocities. The colors represent different cycles: black – cycle 0; green – cycle 1; red – cycle 2; and light blue – cycle 3. The dashed line is the mean value of all observations. Triangles are ESPaDOnS data, and circles are HARPS data.
Current usage metrics show cumulative count of Article Views (full-text article views including HTML views, PDF and ePub downloads, according to the available data) and Abstracts Views on Vision4Press platform.
Data correspond to usage on the plateform after 2015. The current usage metrics is available 48-96 hours after online publication and is updated daily on week days.
Initial download of the metrics may take a while.