Open Access
Fig. 3.
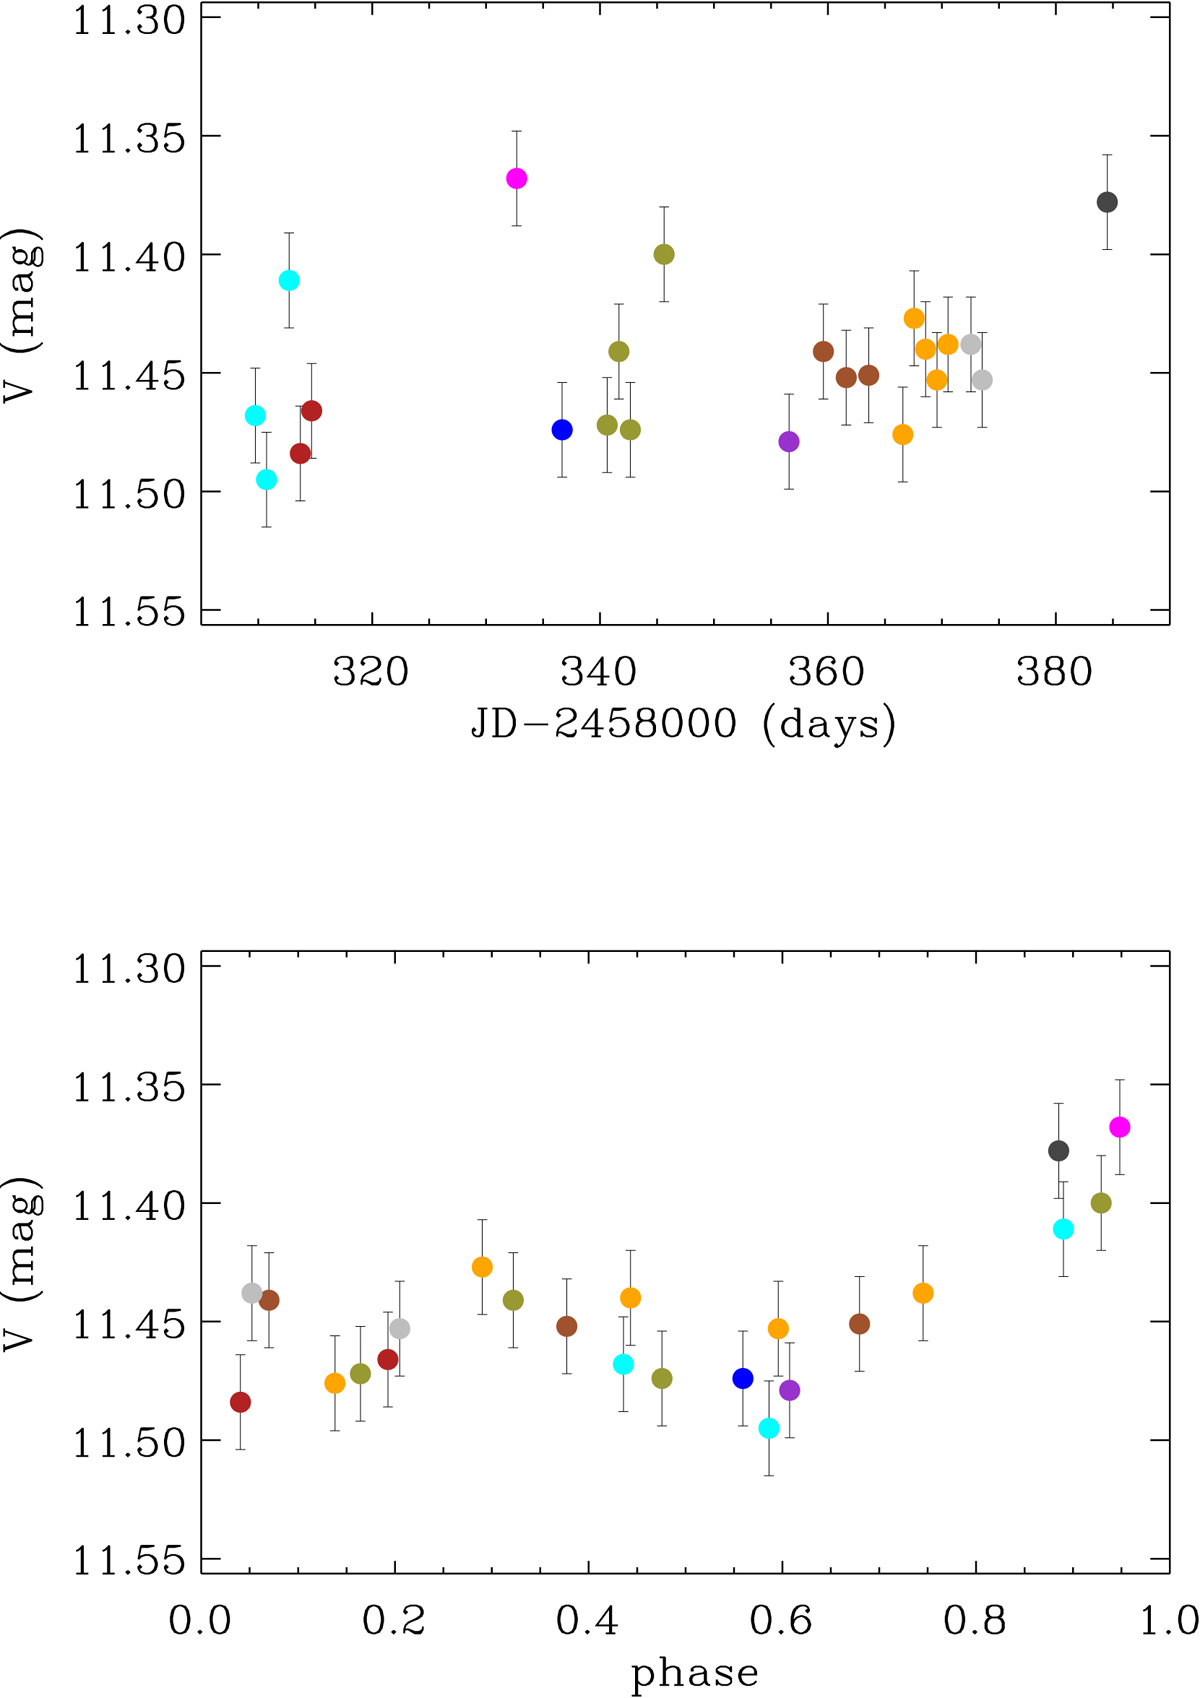
V-band light curve of V2129 Oph from ASAS-SN photometry. Top: direct light curve. Bottom: light curve folded in phase with the ephemeris given in Eq. (1). The colors represent different rotation cycles.
Current usage metrics show cumulative count of Article Views (full-text article views including HTML views, PDF and ePub downloads, according to the available data) and Abstracts Views on Vision4Press platform.
Data correspond to usage on the plateform after 2015. The current usage metrics is available 48-96 hours after online publication and is updated daily on week days.
Initial download of the metrics may take a while.