Fig. C.1.
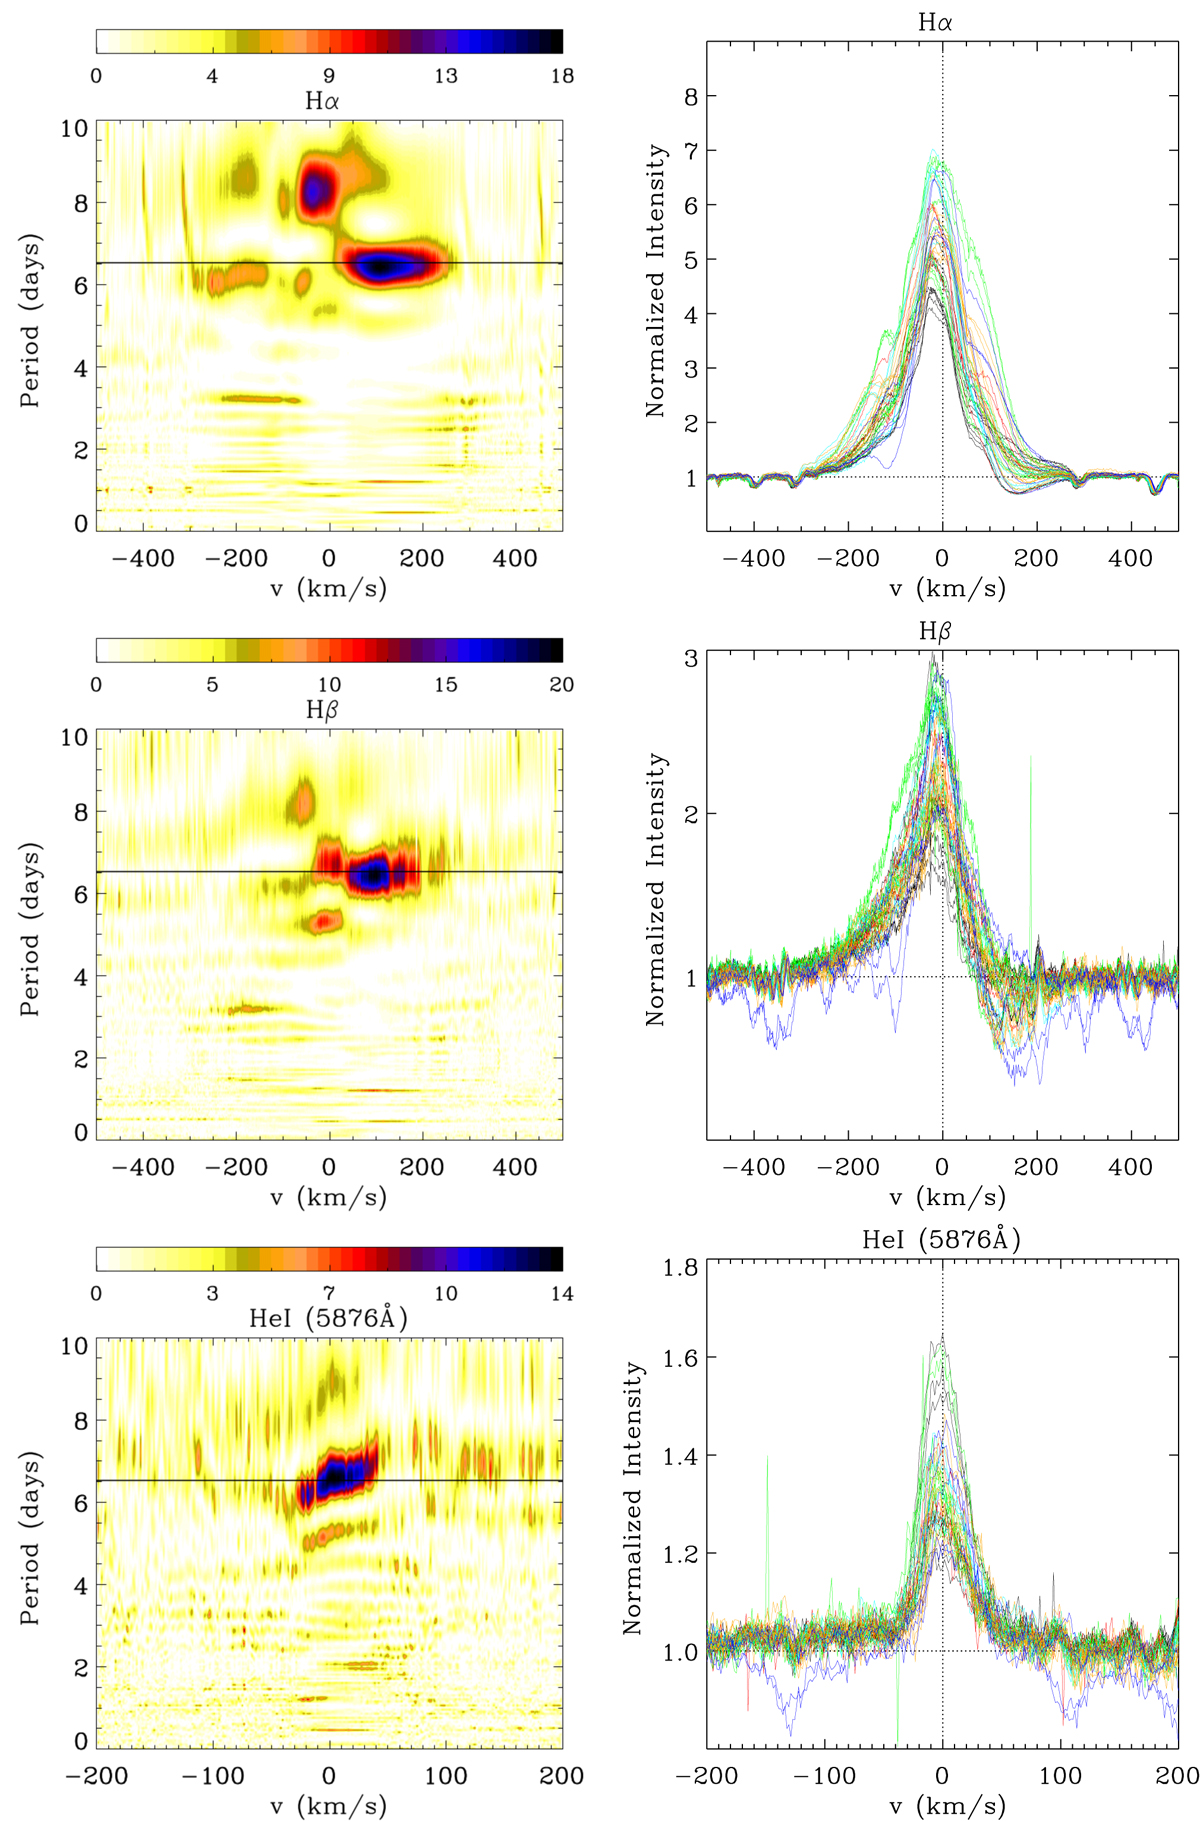
Time series analysis of optical emission lines of the V2129 Oph data from Alencar et al. (2012). Shown are bidimensional periodograms (left) and the corresponding line profiles (right). Left panels: the color range corresponds to the normalized power of the periodogram, and the horizontal solid line represents the rotation period of the star, P = 6.53 days. Right panels: different colors correspond to different rotation cycles.
Current usage metrics show cumulative count of Article Views (full-text article views including HTML views, PDF and ePub downloads, according to the available data) and Abstracts Views on Vision4Press platform.
Data correspond to usage on the plateform after 2015. The current usage metrics is available 48-96 hours after online publication and is updated daily on week days.
Initial download of the metrics may take a while.