Fig. A.1.
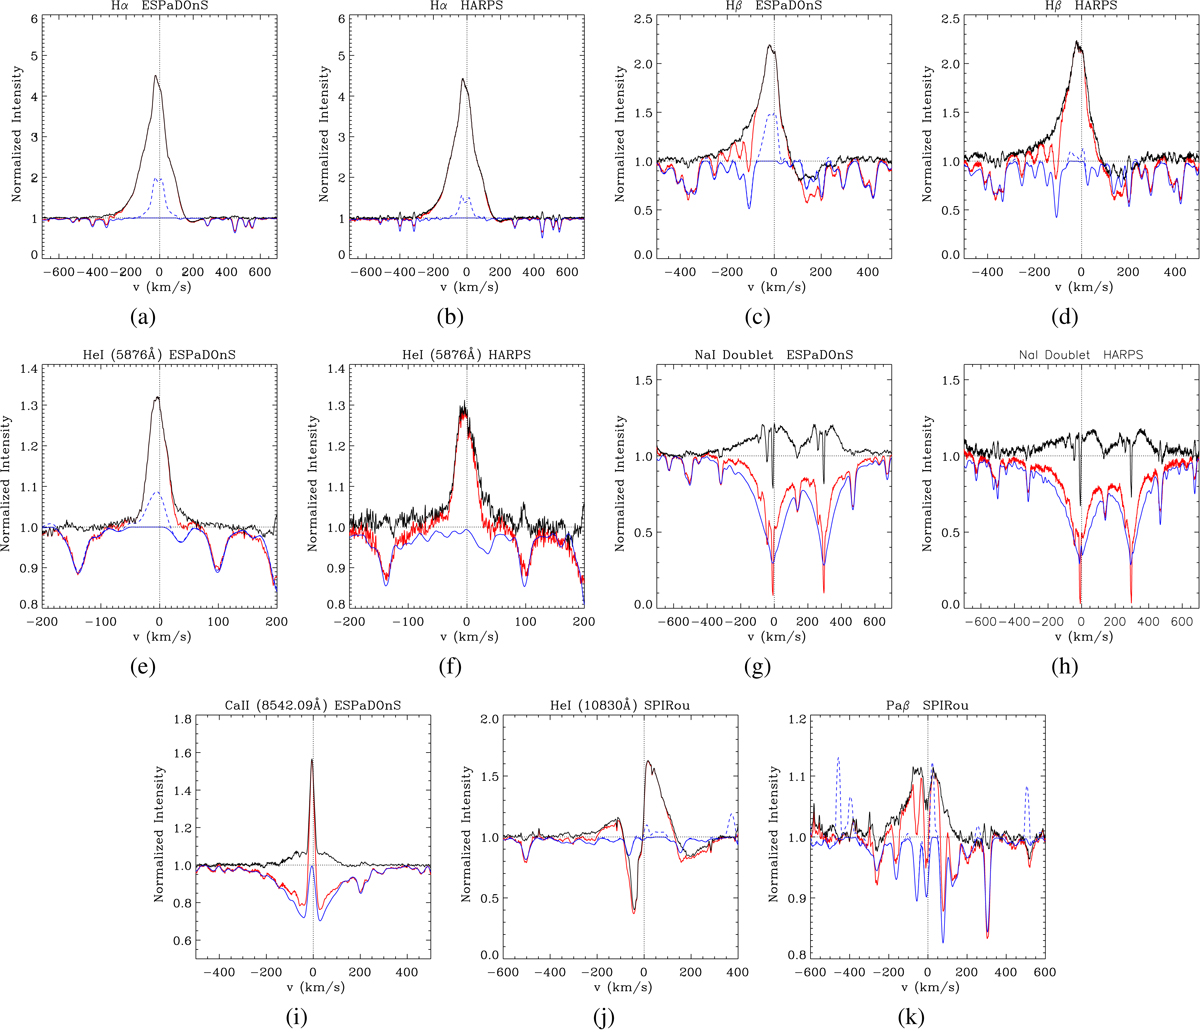
Mean profiles of optical and infrared circumstellar lines. Shown is a comparison of the lines before (red) and after (black) removing the photospheric contribution. The template used, V819 Tau, is shown in blue. Before computing the residual profiles, we removed the chromospheric emission of the template by setting it to the continuum level (solid blue curve). The original template spectra are also shown (dashed blue line). The narrow emission lines in the Paβ template are sky emission components.
Current usage metrics show cumulative count of Article Views (full-text article views including HTML views, PDF and ePub downloads, according to the available data) and Abstracts Views on Vision4Press platform.
Data correspond to usage on the plateform after 2015. The current usage metrics is available 48-96 hours after online publication and is updated daily on week days.
Initial download of the metrics may take a while.