Open Access
Fig. 15.
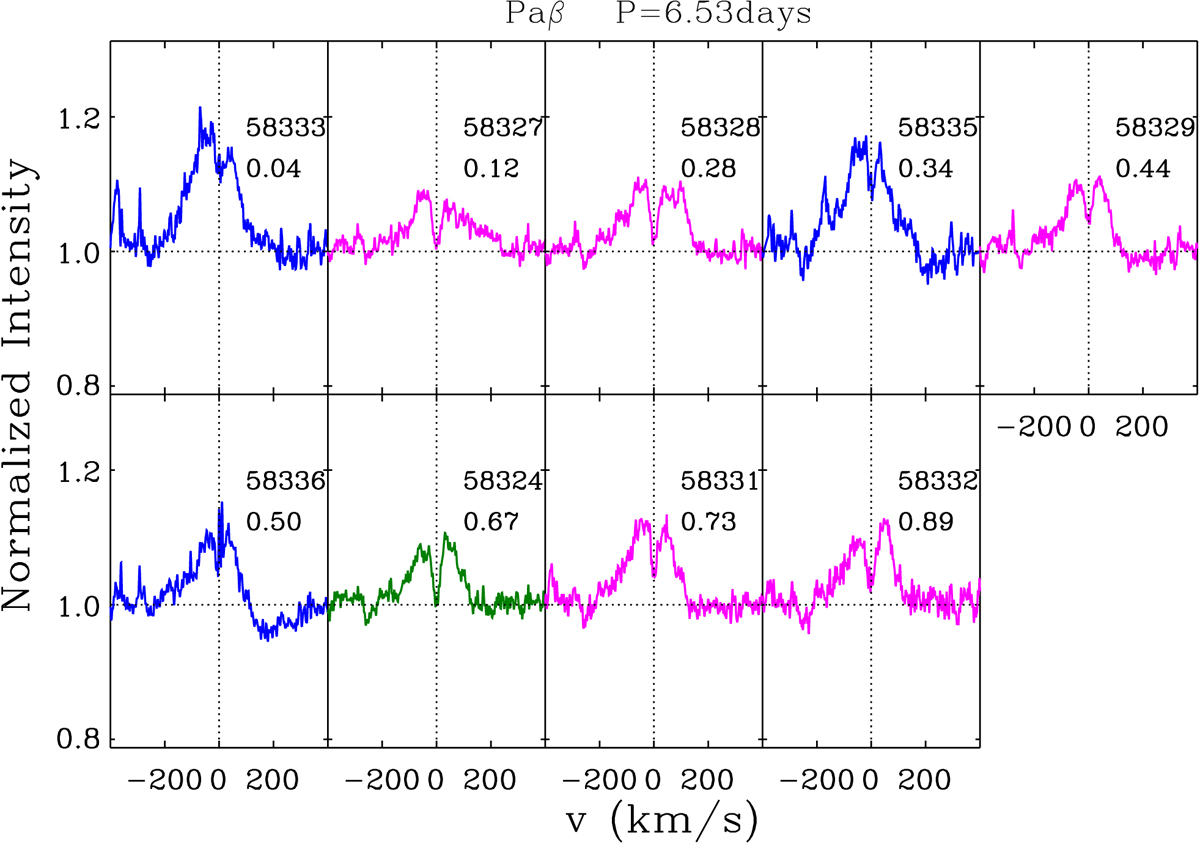
Paβ emission line profiles obtained with the SPIRou spectrograph, organized by phase. The phase and the JD of the observations are written in each panel. The colors represent different rotational cycles.
Current usage metrics show cumulative count of Article Views (full-text article views including HTML views, PDF and ePub downloads, according to the available data) and Abstracts Views on Vision4Press platform.
Data correspond to usage on the plateform after 2015. The current usage metrics is available 48-96 hours after online publication and is updated daily on week days.
Initial download of the metrics may take a while.