Fig. 10.
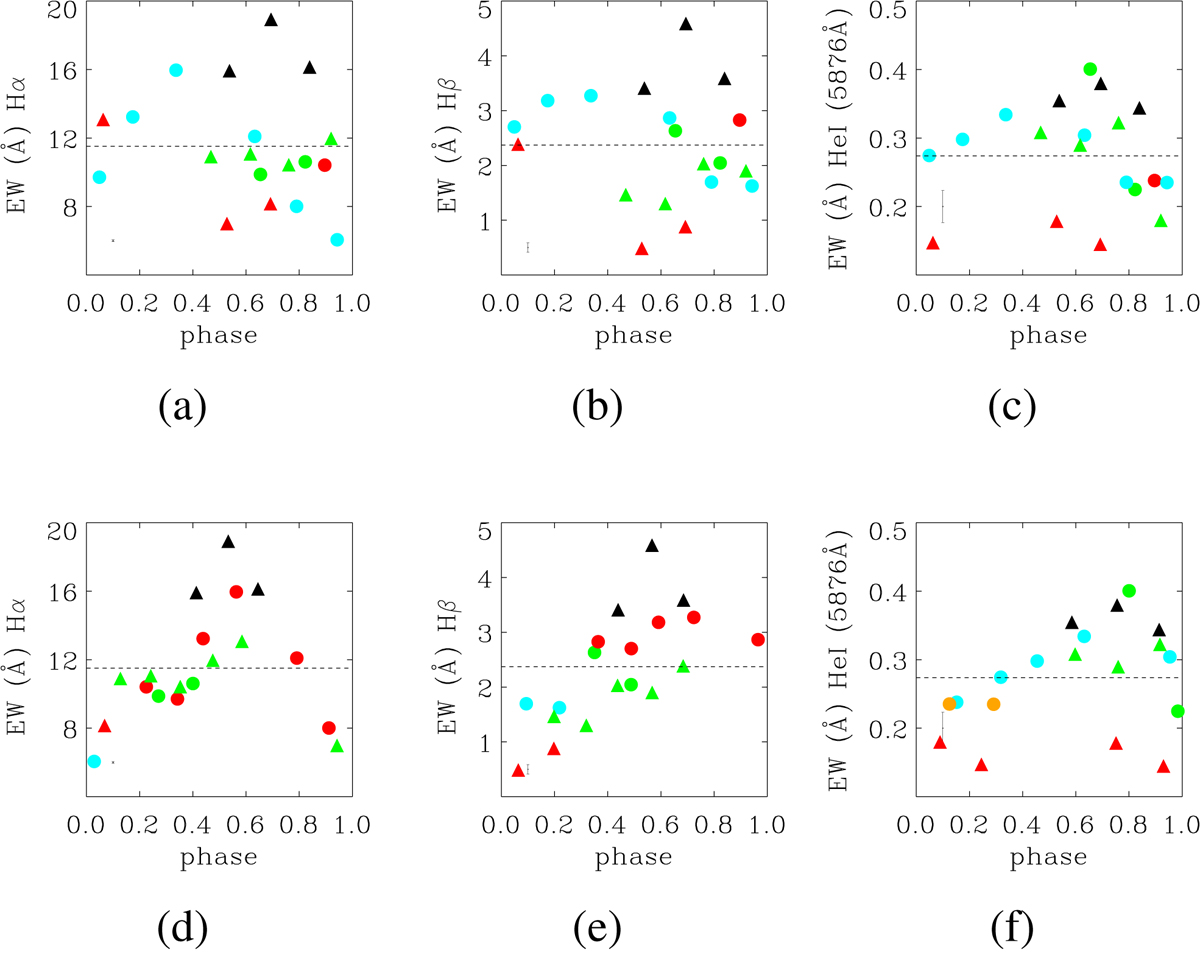
Equivalent widths of emission lines as a function of the rotational phase. Top: phases computed with the stellar rotational period (6.53 days). Bottom: periods of 8.5, 8.0, and 6.0 days used to reconstruct the cycles for, respectively, Hα, Hβ, and He I 5876 Å. Colors represent different rotational cycles. We note that the phase and the duration of a cycle are different in the top and bottom plots. The error bar on the plots are the mean of the 3σ equivalent width uncertainties (see text).
Current usage metrics show cumulative count of Article Views (full-text article views including HTML views, PDF and ePub downloads, according to the available data) and Abstracts Views on Vision4Press platform.
Data correspond to usage on the plateform after 2015. The current usage metrics is available 48-96 hours after online publication and is updated daily on week days.
Initial download of the metrics may take a while.