Fig. 3.
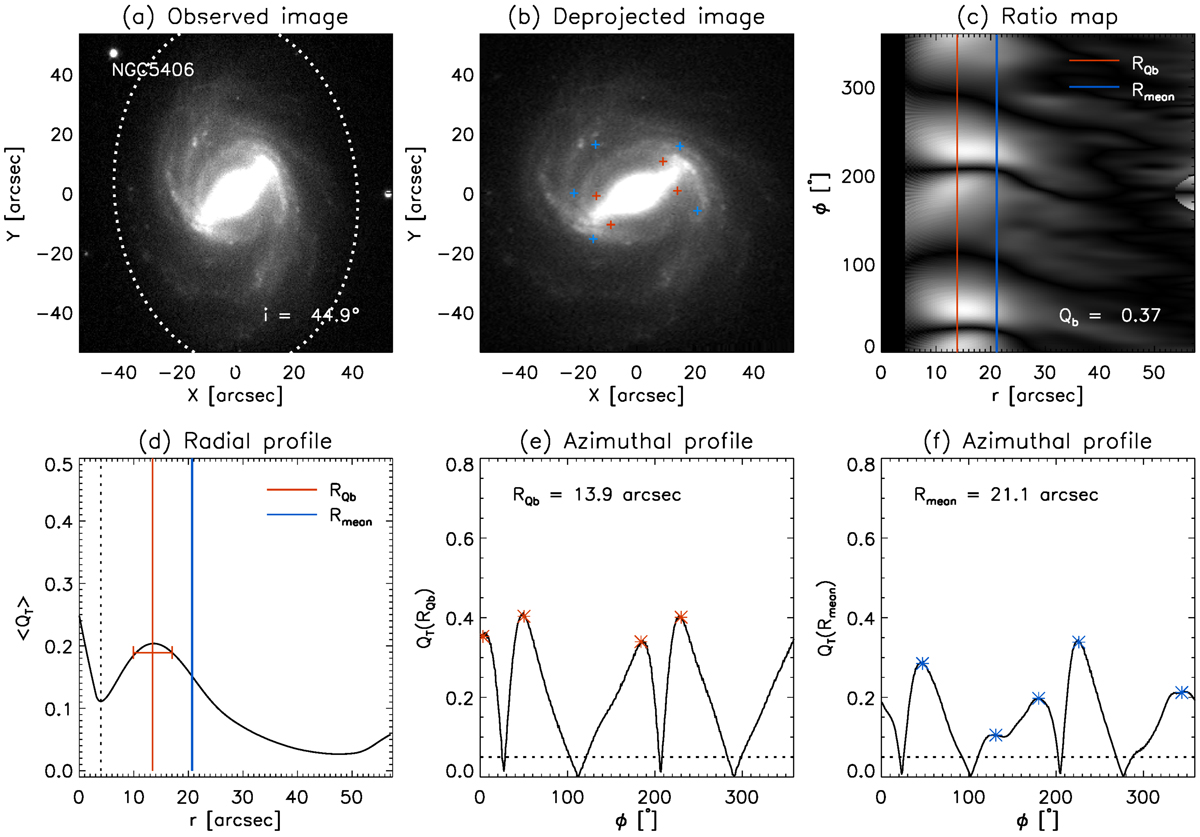
Analysis of the ratio map of NGC 5406. Panel a: observed i-band SDSS image of the galaxy with north up and east left. The dotted ellipse indicates the region of the galaxy considered for the deprojection. The galaxy inclination is given. Panel b: deprojected image of the galaxy. The red and blue crosses correspond to the peaks measured in the QT(RQb) and QT(Rmean) azimuthal profiles, respectively. Panel c: map of the transverse-to-radial force ratio QT(r, ϕ). The vertical blue and red lines indicate the location of RQb and Rmean, respectively. The bar strength is given. Panel d: radial profile of ⟨QT⟩. The vertical dotted line corresponds to the boundary of the bulge-dominated region, identified as the range from the centre to the minimum (or a change in the slope) in the ⟨QT⟩ radial profile. The vertical blue and red lines indicate the location of RQb and Rmean, respectively. The horizontal red segment represents the error associated with RQb. Panel e: azimuthal profile of QT(RQb). The local maxima of the profile are highlighted by red asterisks. The horizontal dotted line corresponds to the threshold value at QT = 0.05, adopted to count the number of peaks associated with the bar. The value of RQb from this paper is given. Panel f: azimuthal profile of QT(Rmean). The local maxima of the profile are highlighted by blue asterisks. The horizontal dotted line corresponds to the threshold value at QT = 0.05, adopted to count the number of peaks associated with the bar. The value of Rmean from literature is given.
Current usage metrics show cumulative count of Article Views (full-text article views including HTML views, PDF and ePub downloads, according to the available data) and Abstracts Views on Vision4Press platform.
Data correspond to usage on the plateform after 2015. The current usage metrics is available 48-96 hours after online publication and is updated daily on week days.
Initial download of the metrics may take a while.