Fig. 1.
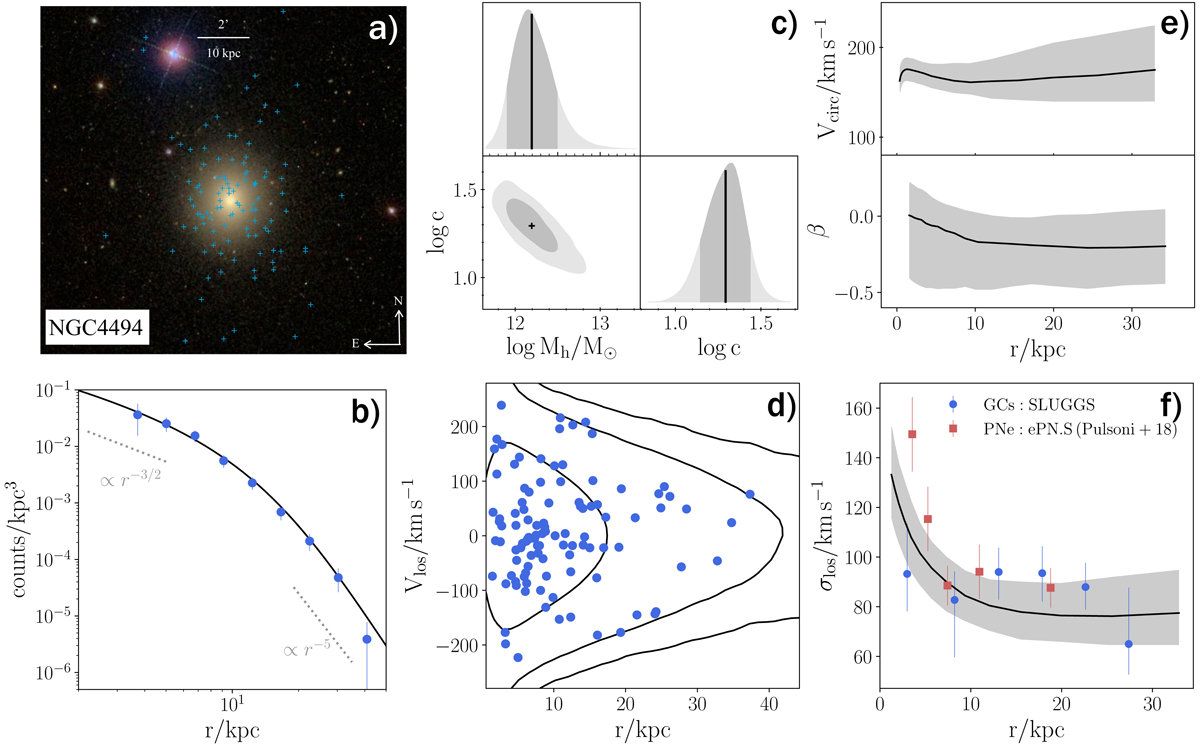
Illustration of our modelling technique using NGC 4494 as an example. In all panels, GC data are shown as blue points, the DF model is shown as a black solid curve, and the 68% confidence interval of the model is shown as a grey shaded area. a: Sloan Digital Sky Survey (SDSS) colour image of the galaxy with blue crosses marking the spectroscopically confirmed GCs in the SLUGGS survey (made with Aladin). b: projected number density profile of the GCs compared to that of the f(J) model. c: marginalised posterior distributions of the halo mass and concentration estimated with an MCMC method. Dark and light grey areas encompass, respectively, 68% and 95% probability, while the black solid lines and cross mark the maximum-likelihood model. d: LOS velocity as a function of projected radius, Vlos − r, for the GCs compared with the projected phase-space density of the maximum-likelihood f(J) model. The contours contain 68–95–99% of the projected phase-space density of the model. e: circular velocity profile, Vcirc (top), and velocity anisotropy profile, ![]() (bottom), of the f(J) model. f: LOS velocity dispersion profile of the GCs measured with SLUGGS data compared to that of our f(J) model. We also compare to independent measurements of the σlos profile of planetary nebulae from Pulsoni et al. (2018, red squares).
(bottom), of the f(J) model. f: LOS velocity dispersion profile of the GCs measured with SLUGGS data compared to that of our f(J) model. We also compare to independent measurements of the σlos profile of planetary nebulae from Pulsoni et al. (2018, red squares).
Current usage metrics show cumulative count of Article Views (full-text article views including HTML views, PDF and ePub downloads, according to the available data) and Abstracts Views on Vision4Press platform.
Data correspond to usage on the plateform after 2015. The current usage metrics is available 48-96 hours after online publication and is updated daily on week days.
Initial download of the metrics may take a while.