Fig. 9
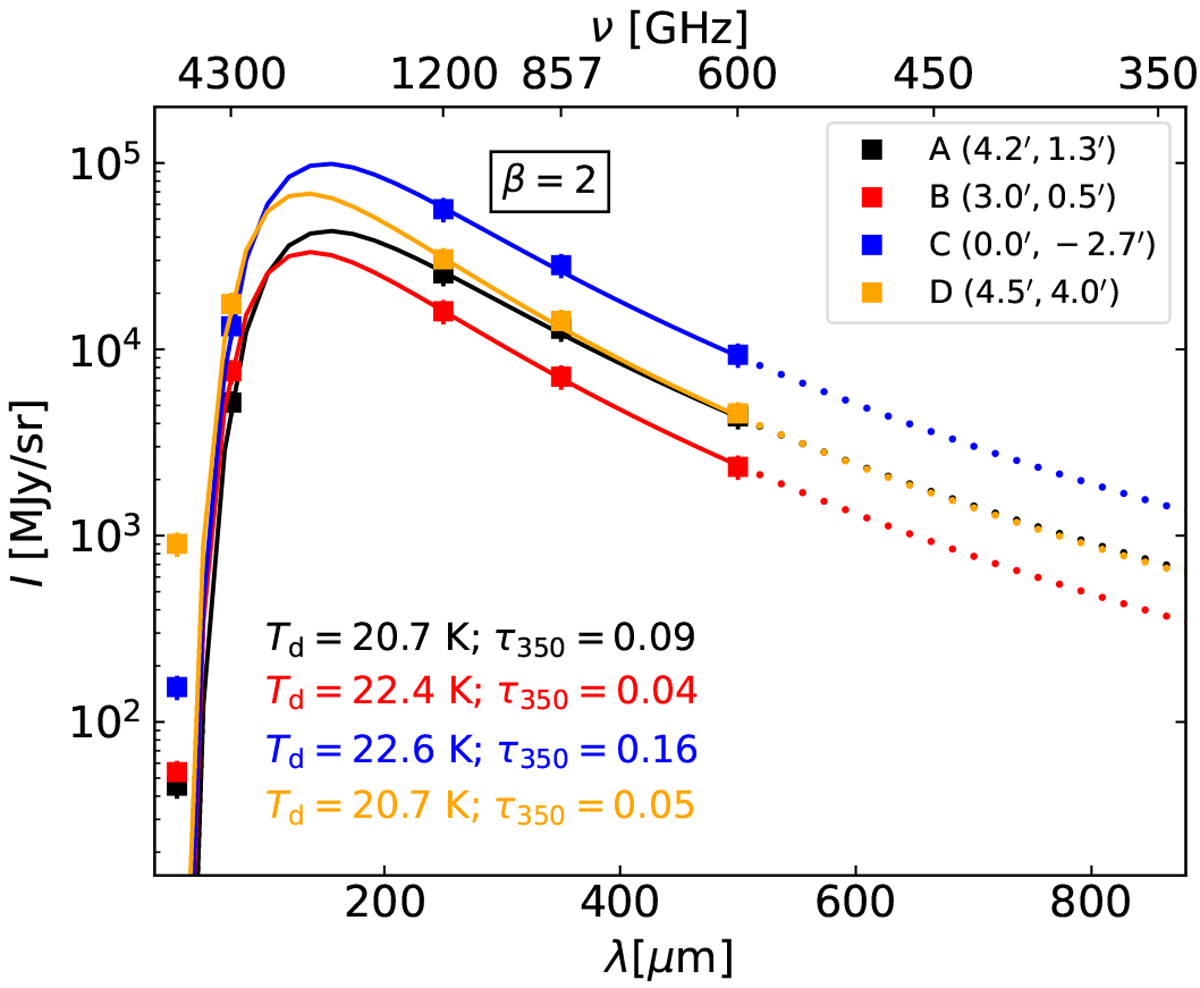
Dust emission: MIPS 24 μm, HiGAL 70, 250, 350, and 500 μm photometric data, all convolved to 42″ resolution (squares, with an intensity uncertainty of ≲15%). Continuous curves show the best-fit BG SEDs of representative positions A, B, C, and D. The 24 μm emissionis produced by hotter VSGs. The area below the continuous curves (40–500 μm) is the integrated FIR intensity (IFIR).
Current usage metrics show cumulative count of Article Views (full-text article views including HTML views, PDF and ePub downloads, according to the available data) and Abstracts Views on Vision4Press platform.
Data correspond to usage on the plateform after 2015. The current usage metrics is available 48-96 hours after online publication and is updated daily on week days.
Initial download of the metrics may take a while.