Fig. 6
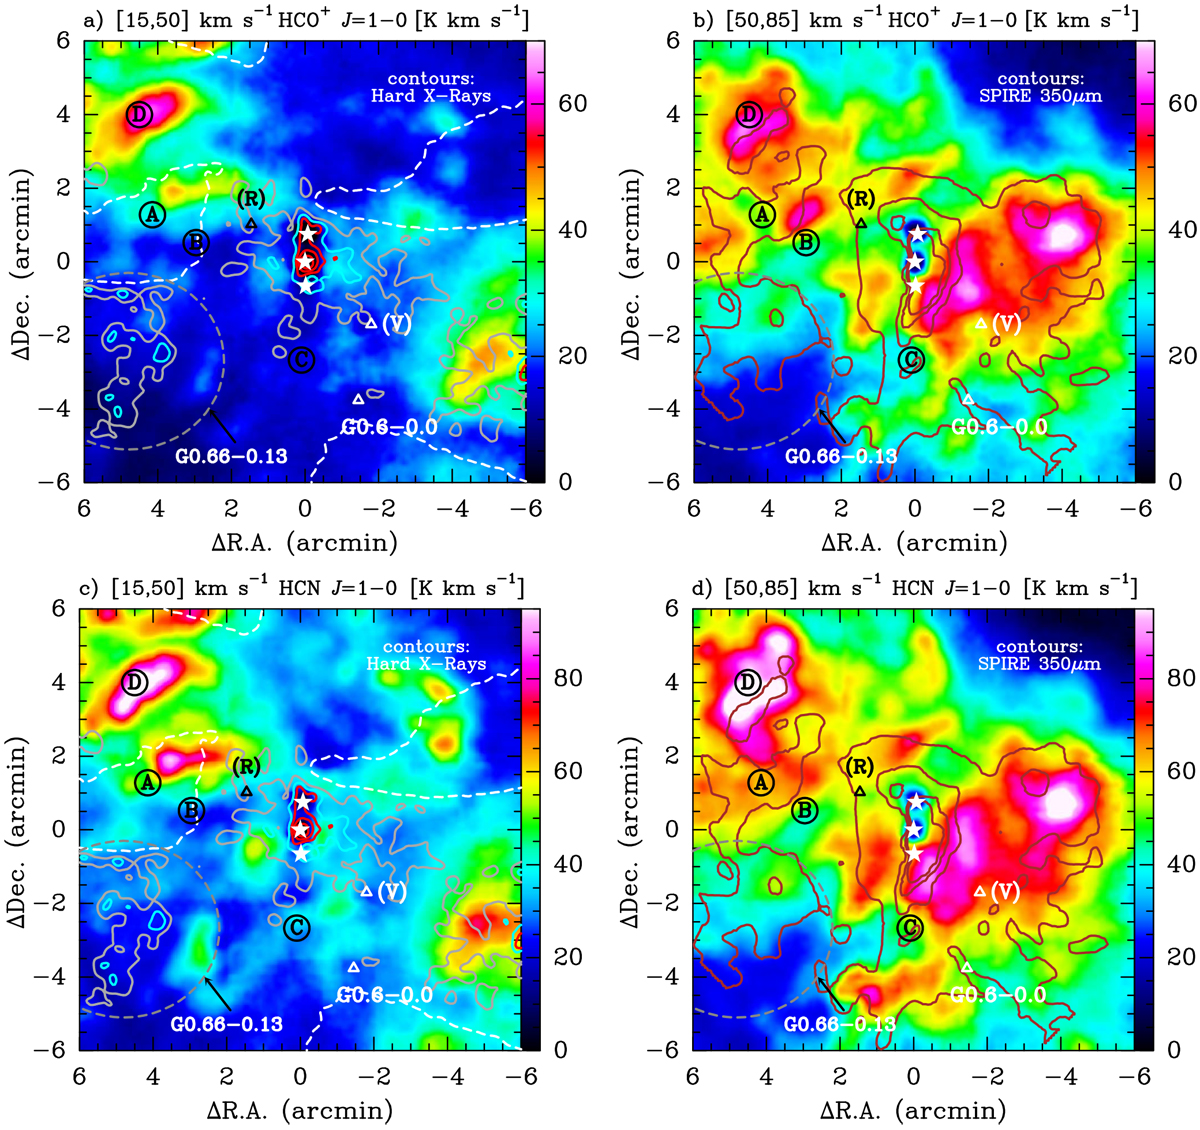
IRAM30 m maps of the HCO+ (1−0) and HCN (1−0) line intensities integrated in the 15−50 km s−1 and 50−85 km s−1 ranges. Contours in panels a and c represent the hard X-Rays emission integrated from 3 to 79 keV, using the 2015 NuSTAR data (Zhang et al. 2015). Gray: 19 × 10−6 ph s−1 pixel−1. Cyan: 22 × 10−6 ph s−1 pixel−1. Red: (24, 26, 28) ×10−6 ph s−1 pixel−1. Dashed white lines delineate the regions with no X-ray observations. Contours inpanels b and d represent the 350 μm data from 8 to 68 by 20 (× 103) MJy sr−1.
Current usage metrics show cumulative count of Article Views (full-text article views including HTML views, PDF and ePub downloads, according to the available data) and Abstracts Views on Vision4Press platform.
Data correspond to usage on the plateform after 2015. The current usage metrics is available 48-96 hours after online publication and is updated daily on week days.
Initial download of the metrics may take a while.