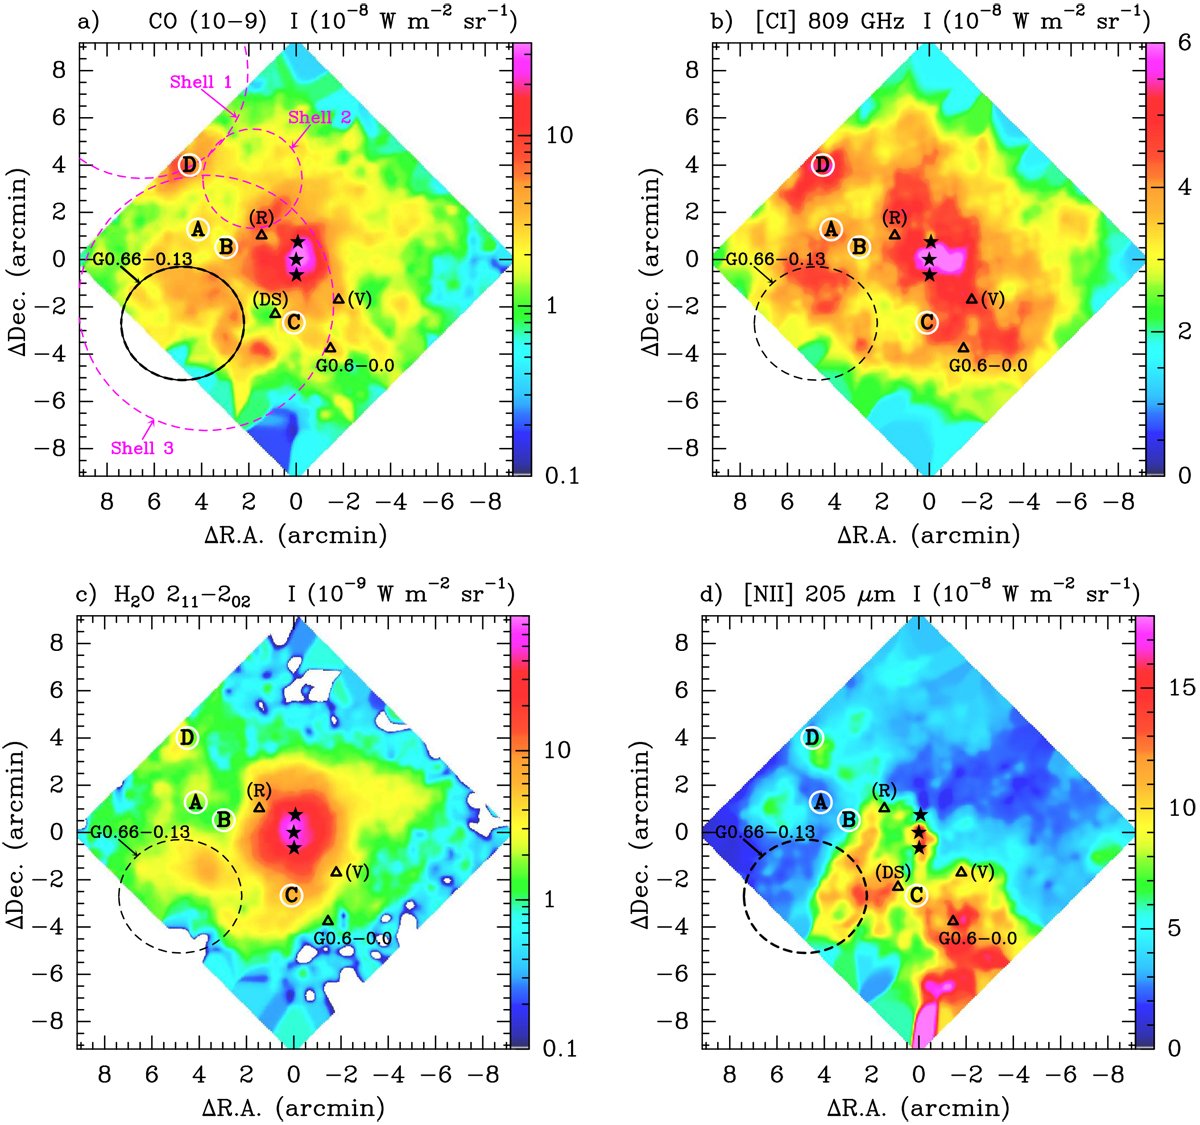
Fig. 2

Selection of SPIRE-FTS integrated line intensity maps. The map center coordinates are those of Sgr B2(M) core: RA, Dec = 17h 47m 20.5s, −28° 23′ 06′′. Black stars mark the location of the three massive star-forming cores Sgr B2(N, M, and S). Black triangles mark other H II regions (Mehringer et al. 1992, 1993; Meng et al. 2019). The black dashed circle of radius 2.5′ (~5.0 pc), centered at RA, Dec = 17h 47m 39.7s, −28° 25′ 48′′ marks a specific X-ray irradiated region (Zhang et al. 2015). The pink dashed circles in panel a show Shells 1, 2, and 3 of Tsuboi et al. (2015). White circles show positions A, B, C, and D.
Current usage metrics show cumulative count of Article Views (full-text article views including HTML views, PDF and ePub downloads, according to the available data) and Abstracts Views on Vision4Press platform.
Data correspond to usage on the plateform after 2015. The current usage metrics is available 48-96 hours after online publication and is updated daily on week days.
Initial download of the metrics may take a while.


