Free Access
Fig. 19
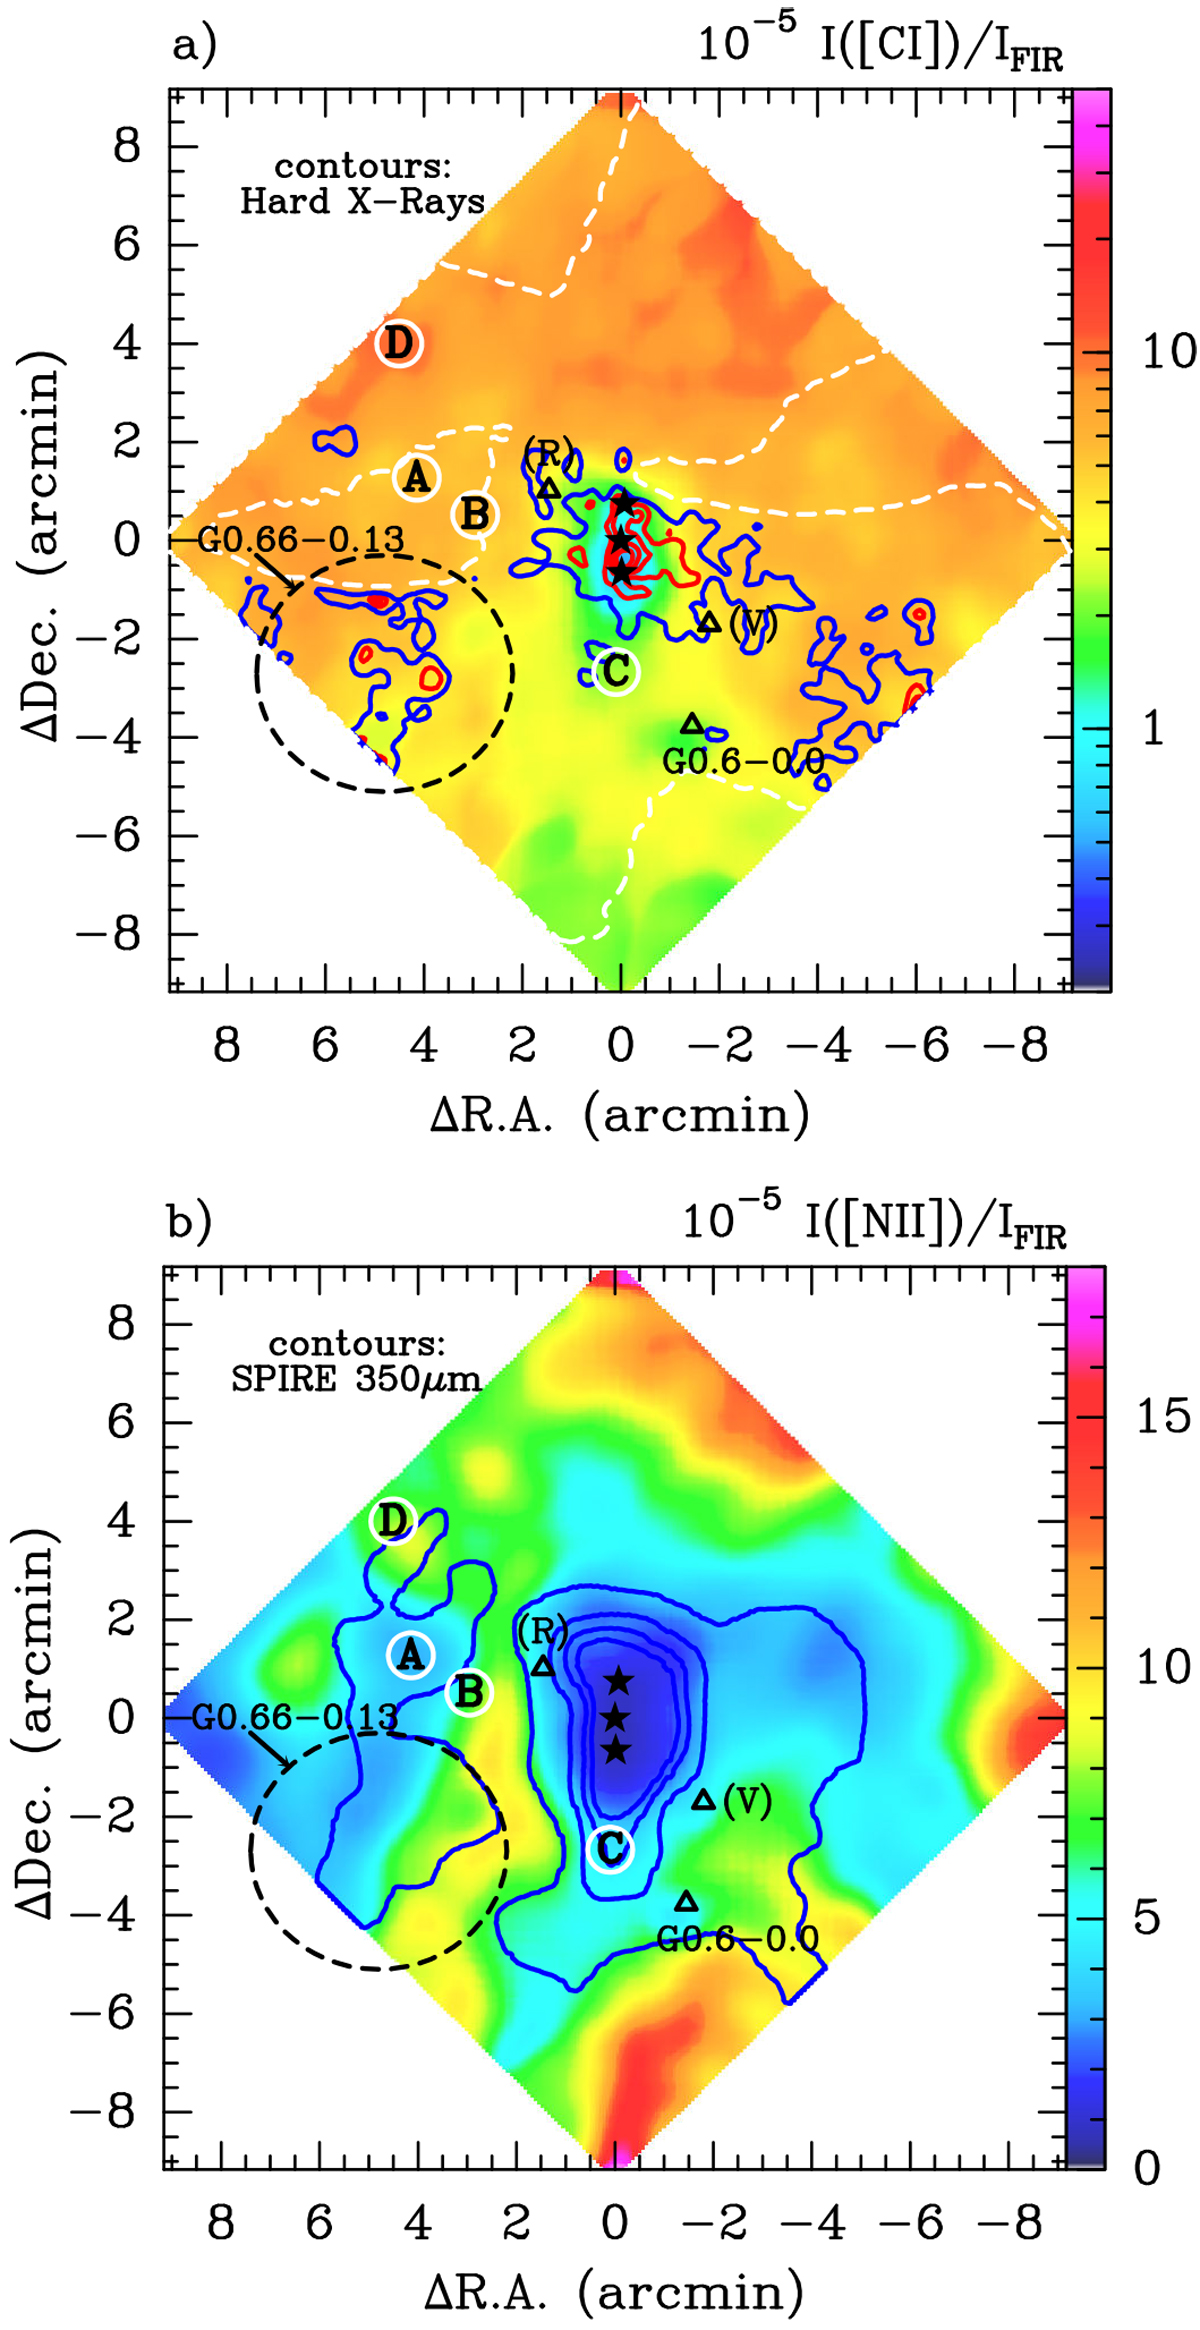
Spatial distribution of the [C I] (492 + 809 GHz) and [NII] 205 μm to FIR intensity ratios in the Sgr B2. (a) Contours represent the hard X-ray emission integrated from 3 to 79 keV, using the 2015 NuSTAR data (same as in Fig. 18). (b) Contours represent the SPIRE 350 μm dust emission.
Current usage metrics show cumulative count of Article Views (full-text article views including HTML views, PDF and ePub downloads, according to the available data) and Abstracts Views on Vision4Press platform.
Data correspond to usage on the plateform after 2015. The current usage metrics is available 48-96 hours after online publication and is updated daily on week days.
Initial download of the metrics may take a while.