Free Access
Fig. 18
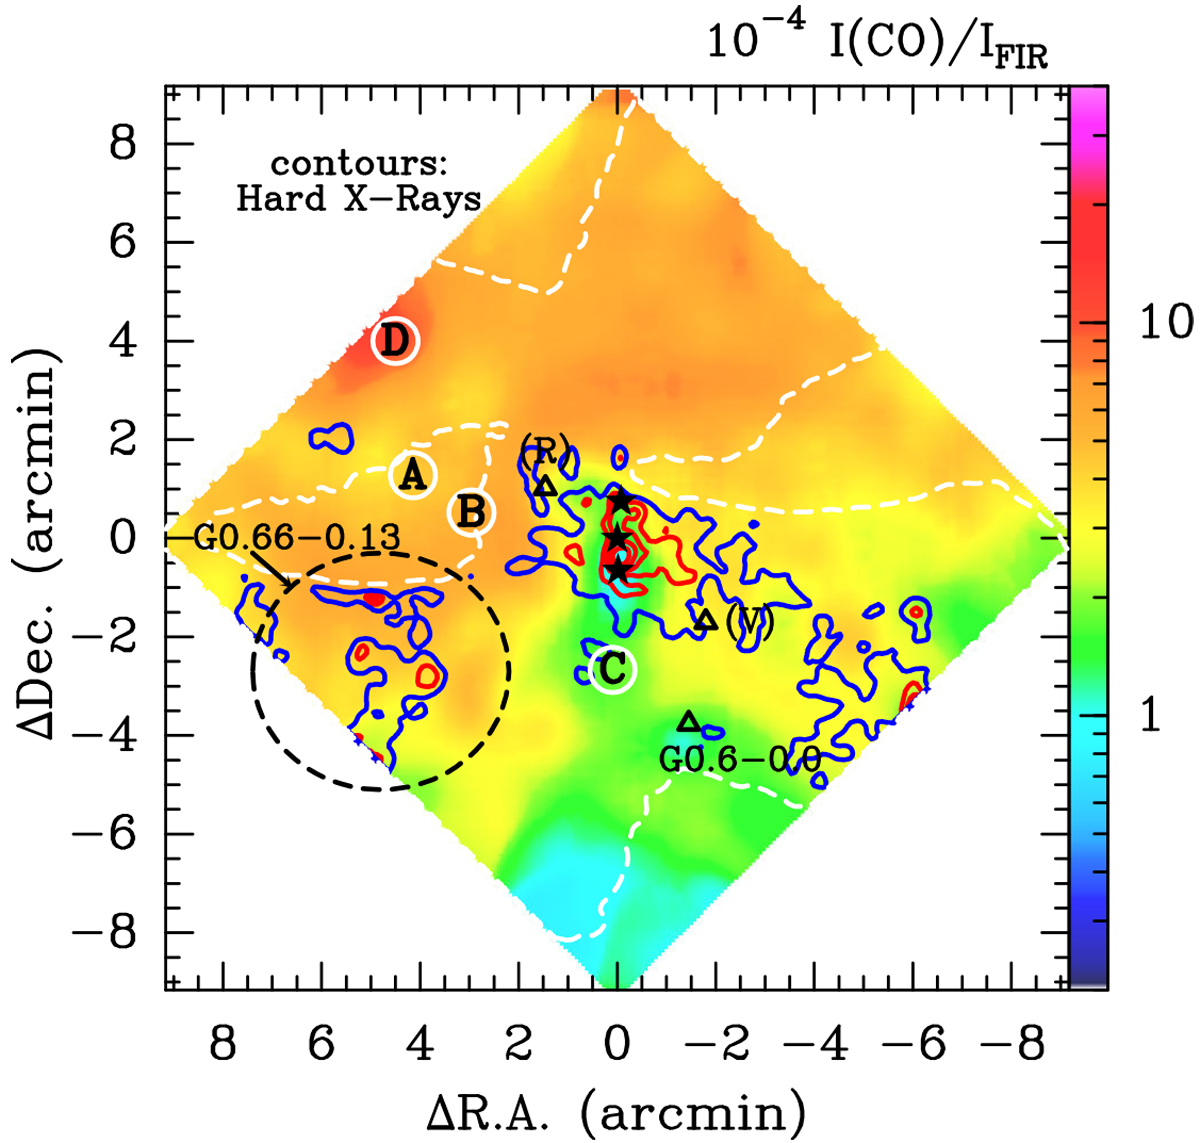
CO to FIR intensity ratio. Contours represent the hard X-ray emission using the 2015 NuSTAR data (S. Zhang priv. comm.; no data inside the areas enclosed by the white dashed lines). Red: (22, 24, 26, 28) ×10−6 ph s−1 pixel−1. Blue: 19 × 10−6 ph s−1 pixel−1.
Current usage metrics show cumulative count of Article Views (full-text article views including HTML views, PDF and ePub downloads, according to the available data) and Abstracts Views on Vision4Press platform.
Data correspond to usage on the plateform after 2015. The current usage metrics is available 48-96 hours after online publication and is updated daily on week days.
Initial download of the metrics may take a while.