Fig. 15
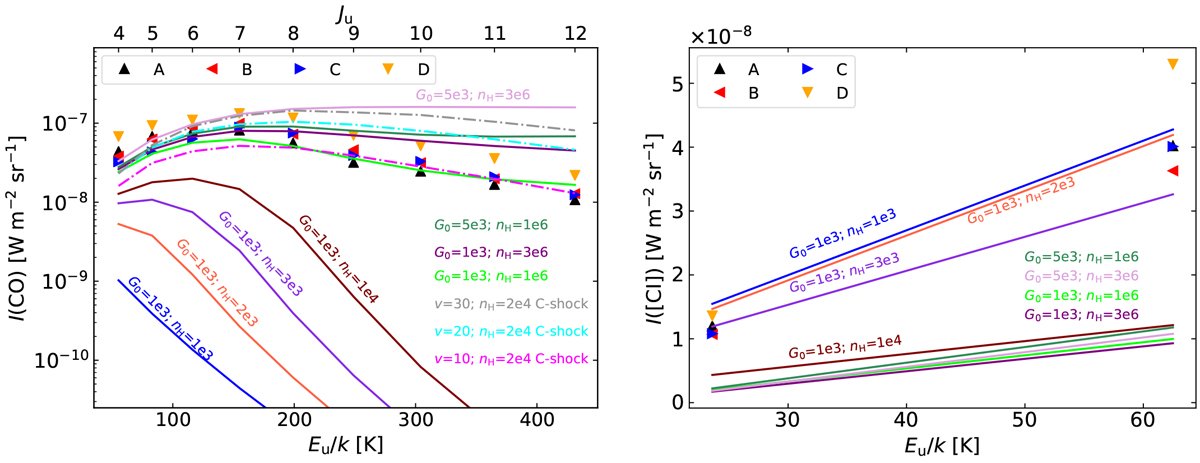
Observed mid-J CO (left panel) and [C I] line intensities (right panel) toward positions A, B, C, and D (shown as triangles). Observed CO and [C I] lines have an intensity uncertainty of ~20%. Continuous curves show predictions from PDR models with different values of G0 and nH (in units of cm−3). Dashed curves in the left panel show C-type shock modelpredictions (from Flower & Pineau Des Forêts 2010).
Current usage metrics show cumulative count of Article Views (full-text article views including HTML views, PDF and ePub downloads, according to the available data) and Abstracts Views on Vision4Press platform.
Data correspond to usage on the plateform after 2015. The current usage metrics is available 48-96 hours after online publication and is updated daily on week days.
Initial download of the metrics may take a while.