Fig. 12
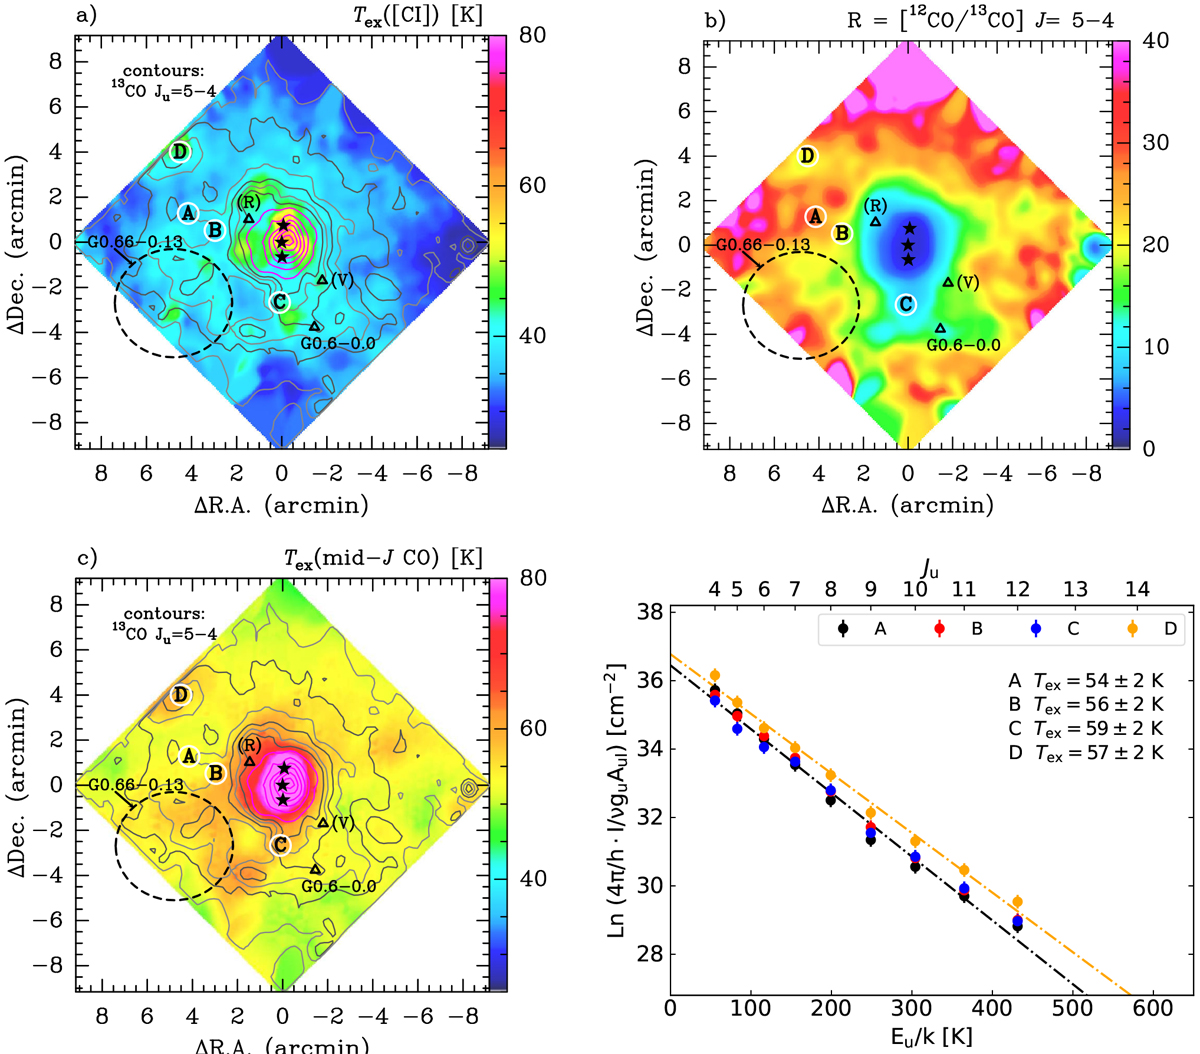
Maps of Tex for (a) atomic carbon and (c) mid-J CO. Contours represent the 13CO J = 5−4 emission from 10−9 W m−2 sr−1 (gray) to 2.8 × 10⁻⁸ W m−2 sr−1 (magenta) tracing high N(H2) regions. (b) Line surface brightness 12CO / 13CO J = 5−4 ratio map. (d) Population diagrams of 12CO lines observed with SPIRE-FTS toward positions A, B, C, and D in Sgr B2 (see Table 4). Dashed curves refer to fits to positions A and D.
Current usage metrics show cumulative count of Article Views (full-text article views including HTML views, PDF and ePub downloads, according to the available data) and Abstracts Views on Vision4Press platform.
Data correspond to usage on the plateform after 2015. The current usage metrics is available 48-96 hours after online publication and is updated daily on week days.
Initial download of the metrics may take a while.