Fig. 1
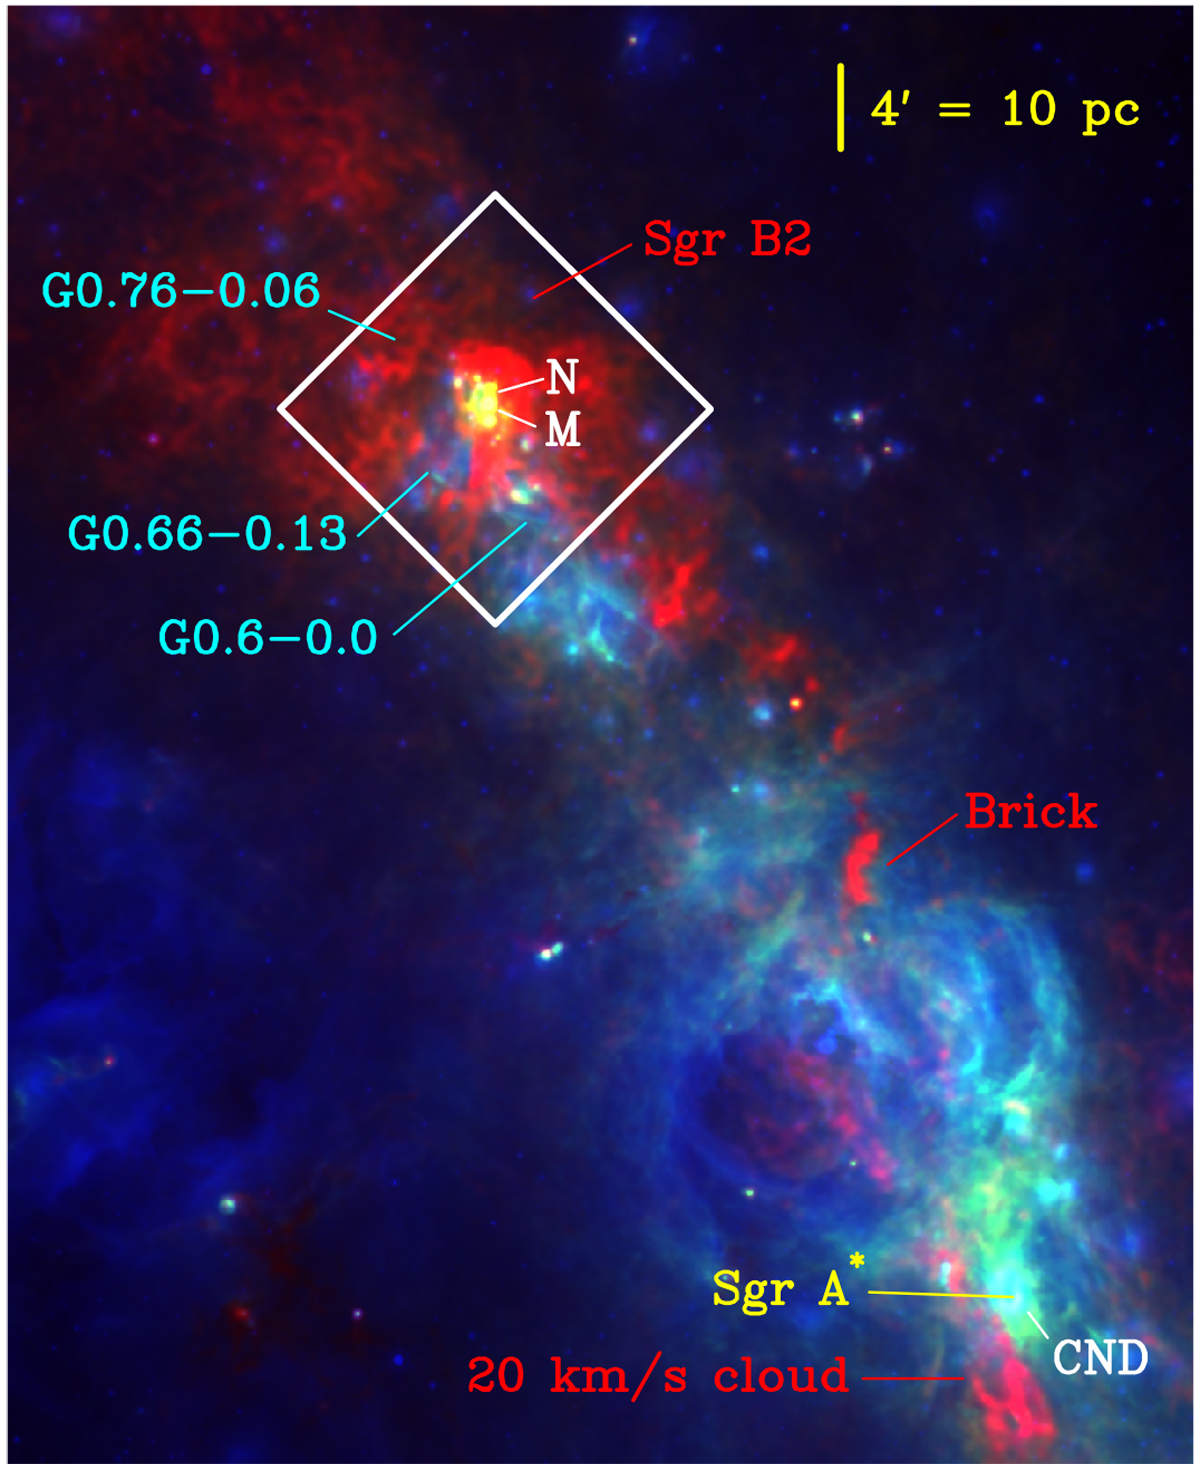
RGB view of about half of the CMZ (~50′ × 60′) in the GC. Red: SPIRE 350 μm tracing cold dust from the most prominent molecular clouds. Green: PACS 70 μm tracing warm dust, mostly in extended PDR-like environments. Blue: MIPS 24 μm tracing hot dust, mostly from ionized regions. The rhombus marks the ~13′ × 13′ area mapped with SPIRE-FTS around Sgr B2(M,N) massive star-forming cores.
Current usage metrics show cumulative count of Article Views (full-text article views including HTML views, PDF and ePub downloads, according to the available data) and Abstracts Views on Vision4Press platform.
Data correspond to usage on the plateform after 2015. The current usage metrics is available 48-96 hours after online publication and is updated daily on week days.
Initial download of the metrics may take a while.