Open Access
Fig. 11.
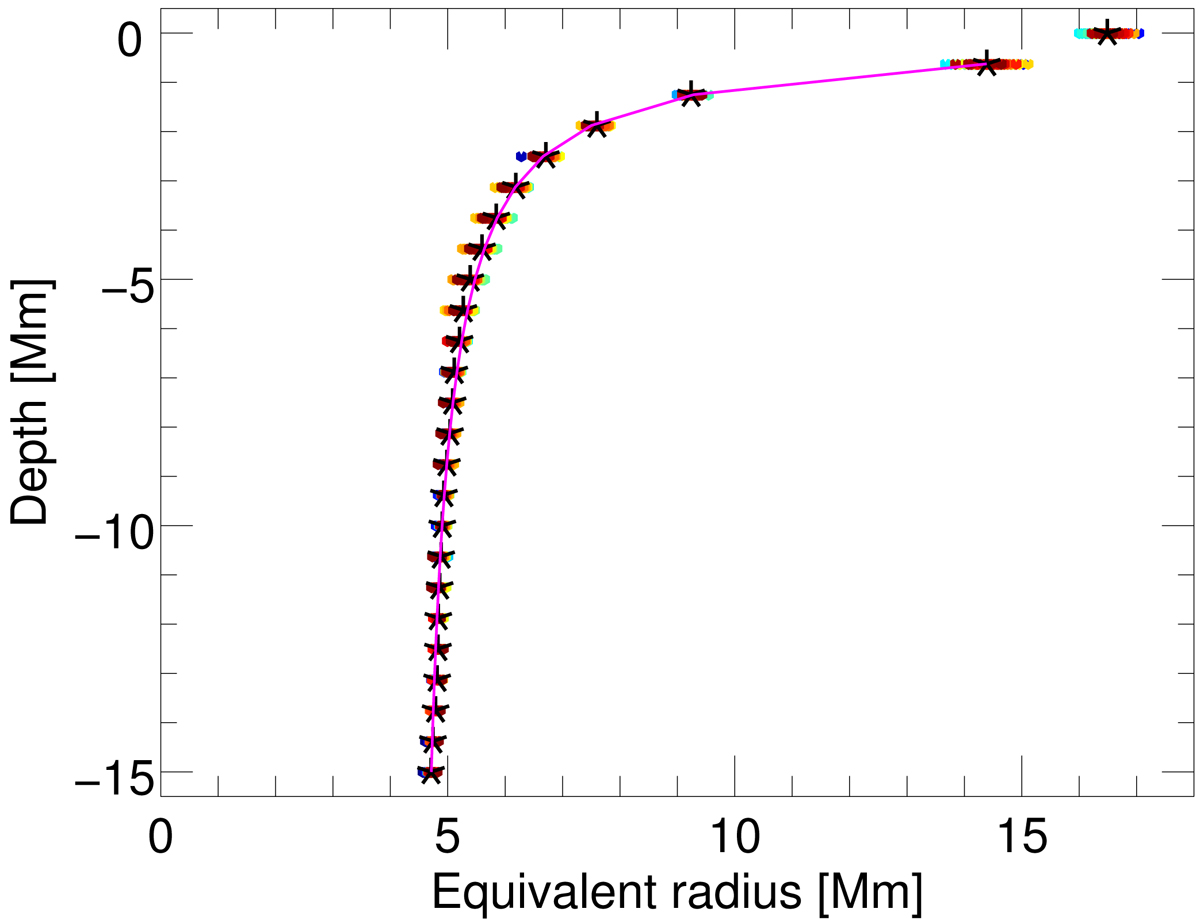
Radial extension of a circular flux tube at different depths obtained from the area A of the simulated sunspot. The time-averaged values (black stars) of all 120 time steps (rainbow-coloured dots, red to blue in time) are fitted by an asymptotic function (magenta line).
Current usage metrics show cumulative count of Article Views (full-text article views including HTML views, PDF and ePub downloads, according to the available data) and Abstracts Views on Vision4Press platform.
Data correspond to usage on the plateform after 2015. The current usage metrics is available 48-96 hours after online publication and is updated daily on week days.
Initial download of the metrics may take a while.