Free Access
Fig. 8.
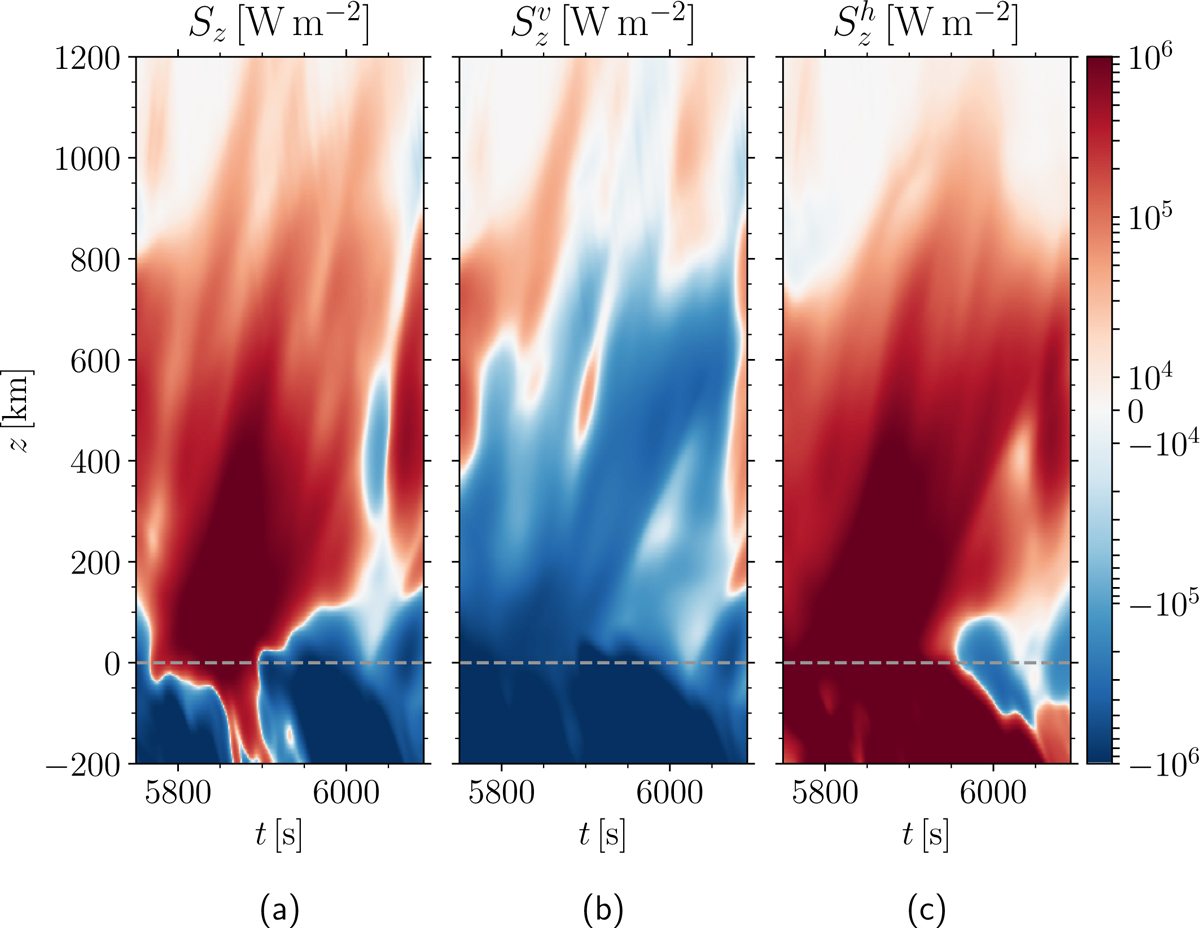
Time–distance diagrams of the vertical component of the Poynting flux vector Sz (a) and of the two terms that compose it, ![]() (b) and
(b) and ![]() (c), for the swirl event shown in Fig. 4. Values at each time step and height level are averages over a finite horizontal plane of 150 km side length.
(c), for the swirl event shown in Fig. 4. Values at each time step and height level are averages over a finite horizontal plane of 150 km side length.
Current usage metrics show cumulative count of Article Views (full-text article views including HTML views, PDF and ePub downloads, according to the available data) and Abstracts Views on Vision4Press platform.
Data correspond to usage on the plateform after 2015. The current usage metrics is available 48-96 hours after online publication and is updated daily on week days.
Initial download of the metrics may take a while.